

Portfolio report - Mangaung.co.za
Portfolio report - Mangaung.co.za
Portfolio report - Mangaung.co.za

Create successful ePaper yourself
Turn your PDF publications into a flip-book with our unique Google optimized e-Paper software.
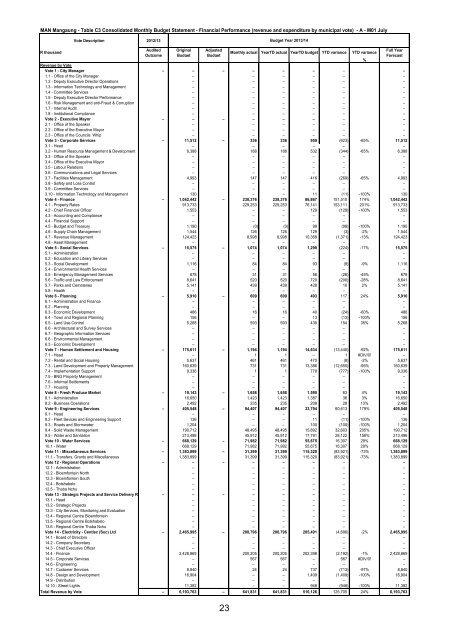
MAN <strong>Mangaung</strong> - Table C3 Consolidated Monthly Budget Statement - Financial Performance (revenue and expenditure by municipal vote) - A - M01 July<br />
Vote Description 2012/13<br />
Budget Year 2013/14<br />
R thousand<br />
Audited<br />
Out<strong>co</strong>me<br />
Original<br />
Budget<br />
Adjusted<br />
Budget<br />
23<br />
Monthly actual YearTD actual YearTD budget YTD variance YTD variance<br />
Full Year<br />
Forecast<br />
%<br />
Revenue by Vote<br />
Vote 1 - City Manager – – – – – – – –<br />
1.1 - Office of the City Manager – – – – – –<br />
1.2 - Deputy Executive Director Operations – – – – – –<br />
1.3 - Information Technology and Management – – – – – –<br />
1.4 - Committee Services – – – – – –<br />
1.5 - Deputy Executive Director Performance – – – – – –<br />
1.6 - Risk Management and anti-Fraud & Corruption – – – – – –<br />
1.7 - Internal Audit – – – – – –<br />
1.8 - Institutional Compliance – – – – – –<br />
Vote 2 - Executive Mayor – – – – – – – –<br />
2.1 - Office of the Speaker – – – – – –<br />
2.2 - Office of the Executive Mayor – – – – – –<br />
2.3 - Office of the Councils Whip – – – – – –<br />
Vote 3 - Corporate Services – 11,512 – 336 336 959 (623) -65% 11,512<br />
3.1 - Head – – – – – –<br />
3.2 - Human Resource Management & Development 6,388 188 188 532 (344) -65% 6,388<br />
3.3 - Office of the Speaker – – – – – –<br />
3.4 - Office of the Executive Mayor – – – – – –<br />
3.5 - Labour Relations – – – – – –<br />
3.6 - Communications and Legal Services – – – – – –<br />
3.7 - Facilities Management 4,993 147 147 416 (269) -65% 4,993<br />
3.8 - Safety and Loss Control – – – – – –<br />
3.9 - Committee Services – – – – – –<br />
3.10 - Information Technology and Management 130 – – 11 (11) -100% 130<br />
Vote 4 - Finance – 1,042,442 – 238,376 238,376 86,867 151,510 174% 1,042,442<br />
4.1 - Property Rates 913,733 229,253 229,253 76,141 153,111 201% 913,733<br />
4.2 - Chief Financial Officer 1,553 – – 129 (129) -100% 1,553<br />
4.3 - Ac<strong>co</strong>unting and Compliance – – – – – –<br />
4.4 - Financial Support – – – – – –<br />
4.5 - Budget and Treasury 1,190 (0) (0) 99 (99) -100% 1,190<br />
4.6 - Supply Chain Management 1,544 126 126 129 (3) -2% 1,544<br />
4.7 - Revenue Management 124,423 8,998 8,998 10,368 (1,371) -13% 124,423<br />
4.8 - Asset Management – – – – – –<br />
Vote 5 - Social Services – 15,575 – 1,074 1,074 1,298 (224) -17% 15,575<br />
5.1 - Administration – – – – – –<br />
5.2 - Education and Library Services – – – – – –<br />
5.3 - Social Development 1,116 84 84 93 (9) -9% 1,116<br />
5.4 - Environmental Health Services – – – – – –<br />
5.5 - Emergency Management Services 678 31 31 56 (26) -45% 678<br />
5.6 - Traffic and Law Enforcement 8,641 520 520 720 (200) -28% 8,641<br />
5.7 - Parks and Cemeteries 5,141 439 439 428 10 2% 5,141<br />
5.8 - Health – – – – – –<br />
Vote 6 - Planning – 5,910 – 609 609 493 117 24% 5,910<br />
6.1 - Administration and Finance – – – – – –<br />
6.2 - Planning – – – – – –<br />
6.3 - E<strong>co</strong>nomic Development 486 16 16 40 (24) -60% 486<br />
6.4 - Town and Regional Planning 156 – – 13 (13) -100% 156<br />
6.5 - Land Use Control 5,268 593 593 439 154 35% 5,268<br />
6.6 - Architectural and Survey Services – – – – – –<br />
6.7 - Geographic Information Services – – – – – –<br />
6.8 - Environmental Management – – – – – –<br />
6.3 - E<strong>co</strong>nomic Development – – – – – –<br />
Vote 7 - Human Settlement and Housing – 175,611 – 1,194 1,194 14,634 (13,440) -92% 175,611<br />
7.1 - Head – 1 1 – 1 #DIV/0! –<br />
7.2 - Rental and Social Housing 5,637 461 461 470 (8) -2% 5,637<br />
7.3 - Land Development and Property Management 160,639 731 731 13,386 (12,655) -95% 160,639<br />
7.4 - Implementation Support 9,336 1 1 778 (777) -100% 9,336<br />
7.5 - BNG Property Management – – – – – –<br />
7.6 - Informal Settlements – – – – – –<br />
7.7 - Housing – – – – – –<br />
Vote 8 - Fresh Produce Market – 19,143 – 1,658 1,658 1,595 63 4% 19,143<br />
8.1 - Administration 16,650 1,423 1,423 1,387 36 3% 16,650<br />
8.2 - Business Operations 2,492 235 235 208 28 13% 2,492<br />
Vote 9 - Engineering Services – 405,548 – 94,407 94,407 33,794 60,613 179% 405,548<br />
9.1 - Head – – – – – –<br />
9.2 - Fleet Sevices and Engineering Support 136 – – 11 (11) -100% 136<br />
9.3 - Roads and Stormwater 1,204 – – 100 (100) -100% 1,204<br />
9.4 - Solid Waste Management 190,712 48,495 48,495 15,892 32,603 205% 190,712<br />
9.5 - Water and Sanitation 213,496 45,912 45,912 17,791 28,122 158% 213,496<br />
Vote 10 - Water Services – 668,129 – 71,982 71,982 55,675 16,307 29% 668,129<br />
10.1 - Water 668,129 71,982 71,982 55,675 16,307 29% 668,129<br />
Vote 11 - Miscellaneous Services – 1,383,899 – 31,399 31,399 115,320 (83,921) -73% 1,383,899<br />
11.1 - Transfers, Grants and Miscellaneous 1,383,899 31,399 31,399 115,320 (83,921) -73% 1,383,899<br />
Vote 12 - Regional Operations – – – – – – – –<br />
12.1 - Administration – – – – – –<br />
12.2 - Bloemfontein North – – – – – –<br />
12.3 - Bloemfontein South – – – – – –<br />
12.4 - Botshabelo – – – – – –<br />
12.5 - Thaba Nchu – – – – – –<br />
Vote 13 - Strategic Projects and Service Delivery Regulation – – – – – – – –<br />
13.1 - Head – – – – – –<br />
13.2 - Strategic Projects – – – – – –<br />
13.3 - City Services, Monitoring and Evaluation – – – – – –<br />
13.4 - Regional Centre Bloemfontein – – – – – –<br />
13.5 - Regional Centre Botshabelo – – – – – –<br />
13.6 - Regional Centre Thaba Nchu – – – – – –<br />
Vote 14 - Electricity - Centlec (Soc) Ltd – 2,465,995 – 200,796 200,796 205,491 (4,696) -2% 2,465,995<br />
14.1 - Board of Directors – – – – – –<br />
14.2 - Company Secretary – – – – – –<br />
14.3 - Chief Executive Officer – – – – – –<br />
14.4 - Finance 2,428,869 200,205 200,205 202,398 (2,192) -1% 2,428,869<br />
14.5 - Corporate Services – 567 567 – 567 #DIV/0! –<br />
14.6 - Engineering – – – – – –<br />
14.7 - Customer Services 8,840 24 24 737 (713) -97% 8,840<br />
14.8 - Design and Development 16,904 – – 1,409 (1,409) -100% 16,904<br />
14.9 - Distribution – – – – – –<br />
14.10 - Street Lights 11,382 – – 948 (948) -100% 11,382<br />
Total Revenue by Vote – 6,193,763 – 641,831 641,831 516,126 125,705 – 24% 6,193,763


