

Portfolio report - Mangaung.co.za
Portfolio report - Mangaung.co.za
Portfolio report - Mangaung.co.za

You also want an ePaper? Increase the reach of your titles
YUMPU automatically turns print PDFs into web optimized ePapers that Google loves.
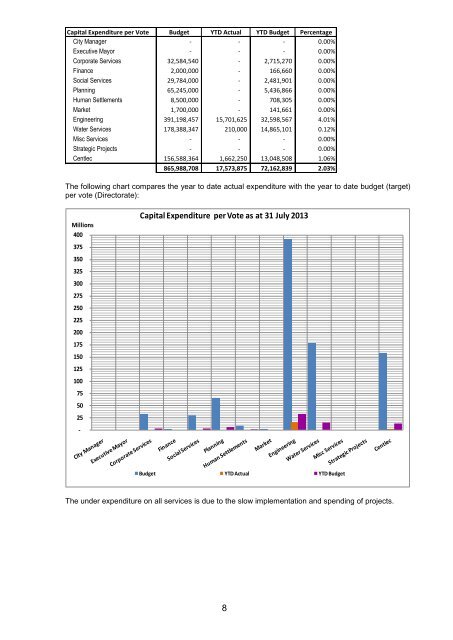
Capital Expenditure per Vote Budget YTD Actual YTD Budget Percentage<br />
City Manager - - - 0.00%<br />
Executive Mayor - - - 0.00%<br />
Corporate Services 32,584,540 - 2,715,270 0.00%<br />
Finance 2,000,000 - 166,660 0.00%<br />
Social Services 29,784,000 - 2,481,901 0.00%<br />
Planning 65,245,000 - 5,436,866 0.00%<br />
Human Settlements 8,500,000 - 708,305 0.00%<br />
Market 1,700,000 - 141,661 0.00%<br />
Engineering 391,198,457 15,701,625 32,598,567 4.01%<br />
Water Services 178,388,347 210,000 14,865,101 0.12%<br />
Misc Services - - - 0.00%<br />
Strategic Projects - - - 0.00%<br />
Centlec 156,588,364 1,662,250 13,048,508 1.06%<br />
865,988,708 17,573,875 72,162,839 2.03%<br />
The following chart <strong>co</strong>mpares the year to date actual expenditure with the year to date budget (target)<br />
per vote (Directorate):<br />
Millions<br />
400<br />
375<br />
350<br />
325<br />
300<br />
275<br />
250<br />
225<br />
200<br />
175<br />
150<br />
125<br />
100<br />
75<br />
50<br />
25<br />
-<br />
Capital Expenditure per Vote as at 31 July 2013<br />
Budget YTD Actual YTD Budget<br />
The under expenditure on all services is due to the slow implementation and spending of projects.<br />
8


