

Portfolio report - Mangaung.co.za
Portfolio report - Mangaung.co.za
Portfolio report - Mangaung.co.za

You also want an ePaper? Increase the reach of your titles
YUMPU automatically turns print PDFs into web optimized ePapers that Google loves.
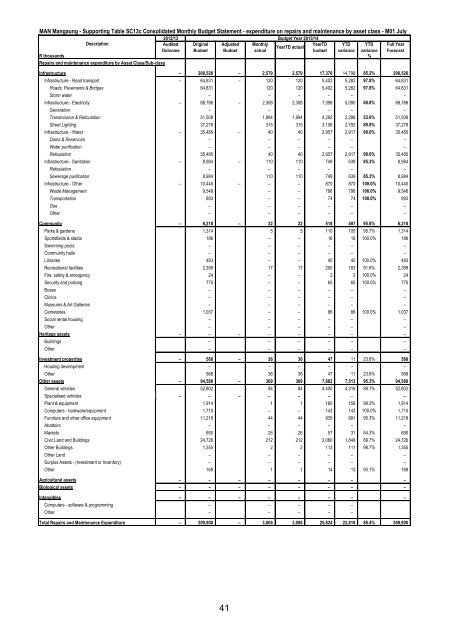
MAN <strong>Mangaung</strong> - Supporting Table SC13c Consolidated Monthly Budget Statement - expenditure on repairs and maintenance by asset class - M01 July<br />
2012/13 Budget Year 2013/14<br />
Description<br />
Audited Original Adjusted Monthly<br />
YearTD YTD YTD Full Year<br />
YearTD actual<br />
Out<strong>co</strong>me Budget Budget actual<br />
budget variance variance Forecast<br />
R thousands %<br />
Repairs and maintenance expenditure by Asset Class/Sub-class<br />
Infrastructure – 208,526 – 2,579 2,579 17,376 14,798 85.2% 208,526<br />
Infrastructure - Road transport – 64,831 – 120 120 5,402 5,282 97.8% 64,831<br />
Roads, Pavements & Bridges 64,831 120 120 5,402 5,282 97.8% 64,831<br />
Storm water – – – – – –<br />
Infrastructure - Electricity – 88,786 – 2,308 2,308 7,398 5,090 68.8% 88,786<br />
Generation – – – – – –<br />
Transmission & Reticulation 51,508 1,994 1,994 4,292 2,298 53.6% 51,508<br />
Street Lighting 37,278 315 315 3,106 2,792 89.9% 37,278<br />
Infrastructure - Water – 35,485 – 40 40 2,957 2,917 98.6% 35,485<br />
Dams & Reservoirs – – – – – –<br />
Water purification – – – – – –<br />
Reticulation 35,485 40 40 2,957 2,917 98.6% 35,485<br />
Infrastructure - Sanitation – 8,984 – 110 110 749 639 85.3% 8,984<br />
Reticulation – – – – – –<br />
Sewerage purification 8,984 110 110 749 639 85.3% 8,984<br />
Infrastructure - Other – 10,440 – – – 870 870 100.0% 10,440<br />
Waste Management 9,548 – – 796 796 100.0% 9,548<br />
Transportation 893 – – 74 74 100.0% 893<br />
Gas – – – – – –<br />
Other – – – – – –<br />
Community – 6,218 – 22 22 518 497 95.8% 6,218<br />
Parks & gardens 1,314 5 5 110 105 95.7% 1,314<br />
Sportsfields & stadia 186 – – 16 16 100.0% 186<br />
Swimming pools – – – – – –<br />
Community halls – – – – – –<br />
Libraries 483 – – 40 40 100.0% 483<br />
Recreational facilities 2,399 17 17 200 183 91.6% 2,399<br />
Fire, safety & emergency 24 – – 2 2 100.0% 24<br />
Security and policing 775 – – 65 65 100.0% 775<br />
Buses – – – – – –<br />
Clinics – – – – – –<br />
Museums & Art Galleries – – – – – –<br />
Cemeteries 1,037 – – 86 86 100.0% 1,037<br />
Social rental housing – – – – – –<br />
Other – – – – – –<br />
Heritage assets – – – – – – – –<br />
Buildings – – – – – –<br />
Other – – – – – –<br />
–<br />
Investment properties – 568 – 36 36 47 11 23.6% 568<br />
Housing development – – – – – –<br />
Other 568 36 36 47 11 23.6% 568<br />
Other assets – 94,588 – 369 369 7,882 7,513 95.3% 94,588<br />
General vehicles 52,802 84 84 4,400 4,316 98.1% 52,802<br />
Specialised vehicles – – – – – – – –<br />
Plant & equipment 1,914 1 1 160 158 99.3% 1,914<br />
Computers - hardware/equipment 1,715 – – 143 143 100.0% 1,715<br />
Furniture and other office equipment 11,218 44 44 935 891 95.3% 11,218<br />
Abattoirs – – – – – –<br />
Markets 690 26 26 57 31 54.3% 690<br />
Civic Land and Buildings 24,726 212 212 2,060 1,848 89.7% 24,726<br />
Other Buildings 1,355 2 2 113 111 98.7% 1,355<br />
Other Land – – – – – –<br />
Surplus Assets - (Investment or Inventory) – – – – – –<br />
Other 169 1 1 14 13 93.1% 169<br />
Agricultural assets – – – – – – – –<br />
Biological assets – – – – – – – –<br />
Intangibles – – – – – – – –<br />
Computers - software & programming – – – – –<br />
Other – – – – –<br />
Total Repairs and Maintenance Expenditure – 309,900 – 3,006 3,006 25,824 22,818 88.4% 309,900<br />
41


