

Portfolio report - Mangaung.co.za
Portfolio report - Mangaung.co.za
Portfolio report - Mangaung.co.za

Create successful ePaper yourself
Turn your PDF publications into a flip-book with our unique Google optimized e-Paper software.
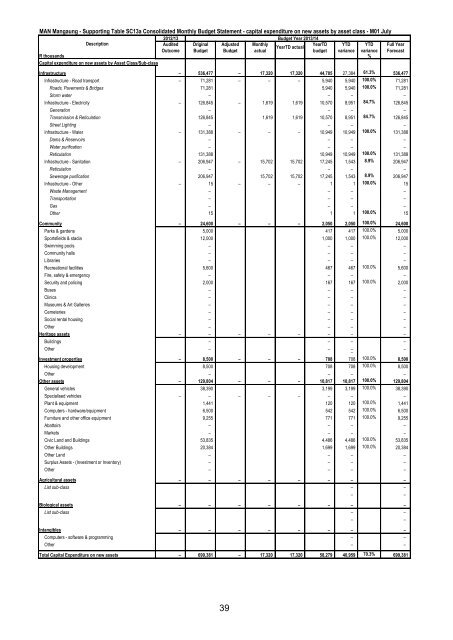
MAN <strong>Mangaung</strong> - Supporting Table SC13a Consolidated Monthly Budget Statement - capital expenditure on new assets by asset class - M01 July<br />
2012/13 Budget Year 2013/14<br />
Description<br />
Audited Original Adjusted Monthly<br />
YearTD YTD YTD Full Year<br />
YearTD actual<br />
Out<strong>co</strong>me Budget Budget actual<br />
budget variance variance Forecast<br />
R thousands %<br />
Capital expenditure on new assets by Asset Class/Sub-class<br />
Infrastructure – 536,477 – 17,320 17,320 44,705 27,384 61.3% 536,477<br />
Infrastructure - Road transport – 71,281 – – – 5,940 5,940 100.0% 71,281<br />
Roads, Pavements & Bridges 71,281 5,940 5,940 100.0% 71,281<br />
Storm water – – – –<br />
Infrastructure - Electricity – 126,845 – 1,619 1,619 10,570 8,951 84.7% 126,845<br />
Generation – – – –<br />
Transmission & Reticulation 126,845 1,619 1,619 10,570 8,951 84.7% 126,845<br />
Street Lighting – – – –<br />
Infrastructure - Water – 131,388 – – – 10,949 10,949 100.0% 131,388<br />
Dams & Reservoirs – – – –<br />
Water purification – – – –<br />
Reticulation 131,388 10,949 10,949 100.0% 131,388<br />
Infrastructure - Sanitation – 206,947 – 15,702 15,702 17,245 1,543 8.9% 206,947<br />
Reticulation – – – –<br />
Sewerage purification 206,947 15,702 15,702 17,245 1,543 8.9% 206,947<br />
Infrastructure - Other – 15 – – – 1 1 100.0% 15<br />
Waste Management – – – –<br />
Transportation – – – –<br />
Gas – – – –<br />
Other 15 1 1 100.0% 15<br />
Community – 24,600 – – – 2,050 2,050 100.0% 24,600<br />
Parks & gardens 5,000 417 417 100.0% 5,000<br />
Sportsfields & stadia 12,000 1,000 1,000 100.0% 12,000<br />
Swimming pools – – – –<br />
Community halls – – – –<br />
Libraries – – – –<br />
Recreational facilities 5,600 467 467 100.0% 5,600<br />
Fire, safety & emergency – – – –<br />
Security and policing 2,000 167 167 100.0% 2,000<br />
Buses – – – –<br />
Clinics – – – –<br />
Museums & Art Galleries – – – –<br />
Cemeteries – – – –<br />
Social rental housing – – – –<br />
Other – – – –<br />
Heritage assets – – – – – – – –<br />
Buildings – – – –<br />
Other – – – –<br />
–<br />
Investment properties – 8,500 – – – 708 708 100.0% 8,500<br />
Housing development 8,500 708 708 100.0% 8,500<br />
Other – – – –<br />
Other assets – 129,804 – – – 10,817 10,817 100.0% 129,804<br />
General vehicles 38,390 3,199 3,199 100.0% 38,390<br />
Specialised vehicles – – – – – – – –<br />
Plant & equipment 1,441 120 120 100.0% 1,441<br />
Computers - hardware/equipment 6,500 542 542 100.0% 6,500<br />
Furniture and other office equipment 9,255 771 771 100.0% 9,255<br />
Abattoirs – – – –<br />
Markets – – – –<br />
Civic Land and Buildings 53,835 4,486 4,486 100.0% 53,835<br />
Other Buildings 20,384 1,699 1,699 100.0% 20,384<br />
Other Land – – – –<br />
Surplus Assets - (Investment or Inventory) – – – –<br />
Other – – – –<br />
Agricultural assets – – – – – – – –<br />
List sub-class – –<br />
– –<br />
Biological assets – – – – – – – –<br />
List sub-class – –<br />
– –<br />
Intangibles – – – – – – – –<br />
Computers - software & programming – –<br />
Other – –<br />
Total Capital Expenditure on new assets – 699,381 – 17,320 17,320 58,279 40,959 70.3% 699,381<br />
39


