

Portfolio report - Mangaung.co.za
Portfolio report - Mangaung.co.za
Portfolio report - Mangaung.co.za

Create successful ePaper yourself
Turn your PDF publications into a flip-book with our unique Google optimized e-Paper software.
Capital expenditure <strong>report</strong> (Annexure B – Table C5)<br />
The Capital expenditure <strong>report</strong> shown in Annexure B has been prepared on the basis of the format<br />
required to be lodged electronically with National Treasury, and is categorised into major output ‘type’.<br />
The actual spending to date is 2.03% (R17.574 million) on the year to date target of R72.163 million.<br />
For the period we have, thus only spent 2.03% of the allocated budget, as against a target of 8.33%.<br />
The summary <strong>report</strong> indicates the following:<br />
Summary Statement of Capital Expenditure - Financing<br />
Budget YTD Budget YTD Actual<br />
Variance<br />
YTD<br />
Description 2013/14 Jul 2013 Jul 2013 Fav/(Unfav)<br />
R’000 R’000 R’000 R’000<br />
Capital Expenditure 865 989 72 163 17 574 (54 589)<br />
Capital Financing<br />
National Government 642 615 53 549 16 022 (37 527)<br />
Provincial Government 43 773 3 648 0 (3 648)<br />
District Municipality 0 0 0 0<br />
Other transfers and Grants 0 0 0 0<br />
Public Contributions 11 888 991 1 508 518<br />
Borrowing 36 684 3 057 0 (3 057)<br />
Internally Generated Funds 131 028 10 919 43 (10 875)<br />
Financing Total 865 989 72 163 17 574 (54 589)<br />
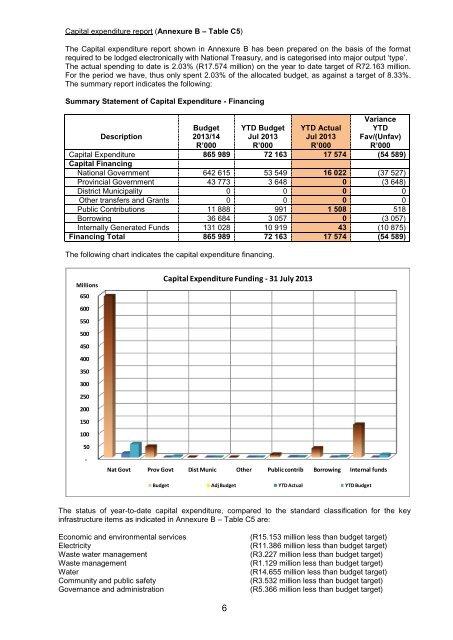
The following chart indicates the capital expenditure financing.<br />
Millions<br />
650<br />
Capital Expenditure Funding - 31 July 2013<br />
600<br />
550<br />
500<br />
450<br />
400<br />
350<br />
300<br />
250<br />
200<br />
150<br />
100<br />
50<br />
-<br />
Nat Govt Prov Govt Dist Munic Other Public <strong>co</strong>ntrib Borrowing Internal funds<br />
Budget Adj Budget YTD Actual YTD Budget<br />
The status of year-to-date capital expenditure, <strong>co</strong>mpared to the standard classification for the key<br />
infrastructure items as indicated in Annexure B – Table C5 are:<br />
E<strong>co</strong>nomic and environmental services<br />
Electricity<br />
Waste water management<br />
Waste management<br />
Water<br />
Community and public safety<br />
Governance and administration<br />
(R15.153 million less than budget target)<br />
(R11.386 million less than budget target)<br />
(R3.227 million less than budget target)<br />
(R1.129 million less than budget target)<br />
(R14.655 million less than budget target)<br />
(R3.532 million less than budget target)<br />
(R5.366 million less than budget target)<br />
6


