Review of Austrian Economics - The Ludwig von Mises Institute
Review of Austrian Economics - The Ludwig von Mises Institute
Review of Austrian Economics - The Ludwig von Mises Institute

You also want an ePaper? Increase the reach of your titles
YUMPU automatically turns print PDFs into web optimized ePapers that Google loves.
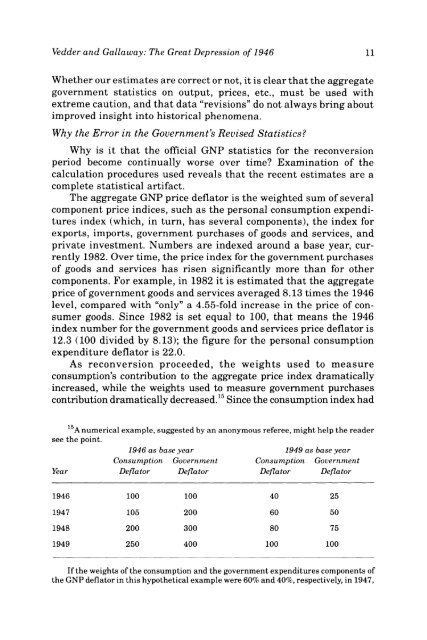
Vedder and Gallaway: <strong>The</strong> Great Depression <strong>of</strong> 1946 11<br />
Whether our estimates are correct or not, it is clear that the aggregate<br />
government statistics on output, prices, etc., must be used with<br />
extreme caution, and that data "revisions" do not always bring about<br />
improved insight into historical phenomena.<br />
Why the Error in the Government's Revised<br />
Statistics?<br />
Why is it that the <strong>of</strong>ficial GNP statistics for the reconversion<br />
period become continually worse over time? Examination <strong>of</strong> the<br />
calculation procedures used reveals that the recent estimates are a<br />
complete statistical artifact.<br />
<strong>The</strong> aggregate GNP price deflator is the weighted sum <strong>of</strong> several<br />
component price indices, such as the personal consumption expenditures<br />
index (which, in turn, has several components), the index for<br />
exports, imports, government purchases <strong>of</strong> goods and services, and<br />
private investment. Numbers are indexed around a base year, currently<br />
1982. Over time, the price index for the government purchases<br />
<strong>of</strong> goods and services has risen significantly more than for other<br />
components. For example, in 1982 it is estimated that the aggregate<br />
price <strong>of</strong> government goods and services averaged 8.13 times the 1946<br />
level, compared with "only" a 4.55-fold increase in the price <strong>of</strong> consumer<br />
goods. Since 1982 is set equal to 100, that means the 1946<br />
index number for the government goods and services price deflator is<br />
12.3 (100 divided by 8.13); the figure for the personal consumption<br />
expenditure deflator is 22.0.<br />
As reconversion proceeded, the weights used to measure<br />
consumption's contribution to the aggregate price index dramatically<br />
increased, while the weights used to measure government purchases<br />
contribution dramatically decreased. 15 Since the consumption index had<br />
A numerical example, suggested by an anonymous referee, might help the reader<br />
see the point.<br />
1946 as base year 1949 as base year<br />
Consumption Government Consumption Government<br />
Year Deflator Deflator Deflator Deflator<br />
1946<br />
100<br />
100<br />
40<br />
25<br />
1947<br />
105<br />
200<br />
60<br />
50<br />
1948<br />
200<br />
300<br />
80<br />
75<br />
1949<br />
250<br />
400<br />
100<br />
100<br />
If the weights <strong>of</strong> the consumption and the government expenditures components <strong>of</strong><br />
the GNP deflator in this hypothetical example were 60% and 40%, respectively, in 1947,