Review of Austrian Economics - The Ludwig von Mises Institute
Review of Austrian Economics - The Ludwig von Mises Institute
Review of Austrian Economics - The Ludwig von Mises Institute

Create successful ePaper yourself
Turn your PDF publications into a flip-book with our unique Google optimized e-Paper software.
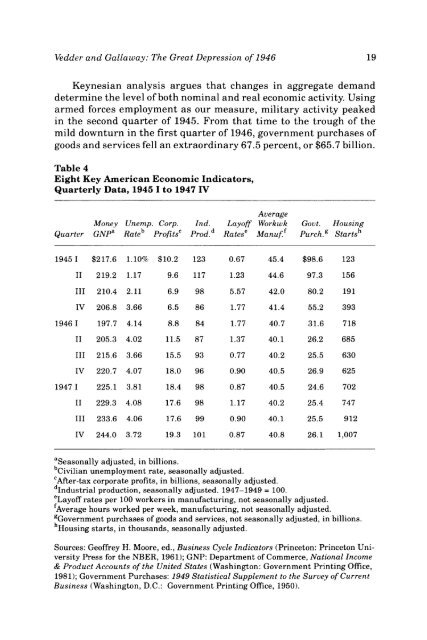
Vedder and Gallaway: <strong>The</strong> Great Depression <strong>of</strong> 1946 19<br />
Keynesian analysis argues that changes in aggregate demand<br />
determine the level <strong>of</strong> both nominal and real economic activity. Using<br />
armed forces employment as our measure, military activity peaked<br />
in the second quarter <strong>of</strong> 1945. From that time to the trough <strong>of</strong> the<br />
mild downturn in the first quarter <strong>of</strong> 1946, government purchases <strong>of</strong><br />
goods and services fell an extraordinary 67.5 percent, or $65.7 billion.<br />
Table 4<br />
Eight Key American Economic Indicators,<br />
Quarterly Data, 1945 I to 1947 IV<br />
Quarter<br />
Money<br />
GNP a<br />
Unemp. Corp.<br />
Rate h Pr<strong>of</strong>its 0<br />
Ind.<br />
Prod d<br />
Lay<strong>of</strong>f<br />
Rates*<br />
Average<br />
Workwk<br />
Manuf.<br />
Govt.<br />
Purch. g<br />
Housing<br />
Starts h<br />
1945 I<br />
$217.6<br />
1.10%<br />
$10.2<br />
123<br />
0.67<br />
45.4<br />
$98.6<br />
123<br />
II<br />
219.2<br />
1.17<br />
9.6<br />
117<br />
1.23<br />
44.6<br />
97.3<br />
156<br />
III<br />
210.4<br />
2.11<br />
6.9<br />
98<br />
5.57<br />
42.0<br />
80.2<br />
191<br />
IV<br />
206.8<br />
3.66<br />
6.5<br />
86<br />
1.77<br />
41.4<br />
55.2<br />
393<br />
1946 1<br />
197.7<br />
4.14<br />
8.8<br />
84<br />
1.77<br />
40.7<br />
31.6<br />
718<br />
II<br />
205.3<br />
4.02<br />
11.5<br />
87<br />
1.37<br />
40.1<br />
26.2<br />
685<br />
III<br />
215.6<br />
3.66<br />
15.5<br />
93<br />
0.77<br />
40.2<br />
25.5<br />
630<br />
IV<br />
220.7<br />
4.07<br />
18.0<br />
96<br />
0.90<br />
40.5<br />
26.9<br />
625<br />
1947 1<br />
225.1<br />
3.81<br />
18.4<br />
98<br />
0.87<br />
40.5<br />
24.6<br />
702<br />
II<br />
229.3<br />
4.08<br />
17.6<br />
98<br />
1.17<br />
40.2<br />
25.4<br />
747<br />
III<br />
233.6<br />
4.06<br />
17.6<br />
99<br />
0.90<br />
40.1<br />
25.5<br />
912<br />
IV<br />
244.0<br />
3.72<br />
19.3<br />
101<br />
0.87<br />
40.8<br />
26.1<br />
1,007<br />
a Seasonally adjusted, in billions.<br />
Civilian unemployment rate, seasonally adjusted.<br />
c After-tax corporate pr<strong>of</strong>its, in billions, seasonally adjusted,<br />
industrial production, seasonally adjusted. 1947-1949 = 100.<br />
e Lay<strong>of</strong>f rates per 100 workers in manufacturing, not seasonally adjusted.<br />
Average hours worked per week, manufacturing, not seasonally adjusted.<br />
g Government purchases <strong>of</strong> goods and services, not seasonally adjusted, in billions.<br />
Housing starts, in thousands, seasonally adjusted.<br />
Sources: Ge<strong>of</strong>frey H. Moore, ed., Business Cycle Indicators (Princeton: Princeton University<br />
Press for the NBER, 1961); GNP: Department <strong>of</strong> Commerce, National Income<br />
& Product Accounts <strong>of</strong> the United States (Washington: Government Printing Office,<br />
1981); Government Purchases: 1949 Statistical Supplement to the Survey <strong>of</strong> Current<br />
Business (Washington, D.C.: Government Printing Office, 1950).