Review of Austrian Economics - The Ludwig von Mises Institute
Review of Austrian Economics - The Ludwig von Mises Institute
Review of Austrian Economics - The Ludwig von Mises Institute

Create successful ePaper yourself
Turn your PDF publications into a flip-book with our unique Google optimized e-Paper software.
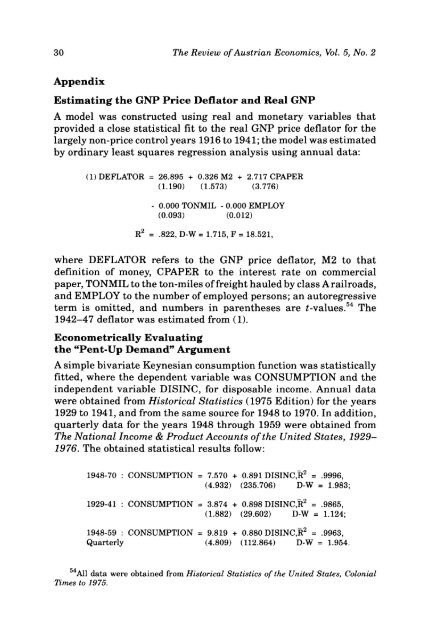
30 <strong>The</strong> <strong>Review</strong> <strong>of</strong> <strong>Austrian</strong> <strong>Economics</strong>, Vol. 5, No. 2<br />
Appendix<br />
Estimating the GNP Price Deflator and Real GNP<br />
A model was constructed using real and monetary variables that<br />
provided a close statistical fit to the real GNP price deflator for the<br />
largely non-price control years 1916 to 1941; the model was estimated<br />
by ordinary least squares regression analysis using annual data:<br />
(1) DEFLATOR = 26.895 + 0.326 M2 + 2.717 CPAPER<br />
(1.190) (1.573) (3.776)<br />
- 0.000 TONMIL - 0.000 EMPLOY<br />
(0.093) (0.012)<br />
R 2 = .822, D-W = 1.715, F = 18.521,<br />
where DEFLATOR refers to the GNP price deflator, M2 to that<br />
definition <strong>of</strong> money, CPAPER to the interest rate on commercial<br />
paper, TONMIL to the ton-miles <strong>of</strong> freight hauled by class A railroads,<br />
and EMPLOY to the number <strong>of</strong> employed persons; an autoregressive<br />
term is omitted, and numbers in parentheses are ^-values. 54 <strong>The</strong><br />
1942-47 deflator was estimated from (1).<br />
Econometrically Evaluating<br />
the "Pent-Up Demand" Argument<br />
A simple bivariate Keynesian consumption function was statistically<br />
fitted, where the dependent variable was CONSUMPTION and the<br />
independent variable DISINC, for disposable income. Annual data<br />
were obtained from Historical Statistics (1975 Edition) for the years<br />
1929 to 1941, and from the same source for 1948 to 1970. In addition,<br />
quarterly data for the years 1948 through 1959 were obtained from<br />
<strong>The</strong> National Income & Product Accounts <strong>of</strong> the United States, 1929-<br />
1976. <strong>The</strong> obtained statistical results follow:<br />
1948-70 : CONSUMPTION = 7.570 + 0.891 DISINC,R 2 = .9996,<br />
(4.932) (235.706) D-W = 1.983;<br />
1929-41 : CONSUMPTION = 3.874 + 0.898 DISINC,R 2 = .9865,<br />
(1.882) (29.602) D-W = 1.124;<br />
1948-59 : CONSUMPTION = 9.819 + 0.880 DISINC,R 2 = .9963,<br />
Quarterly (4.809) (112.864) D-W = 1.954.<br />
54 All data were obtained from Historical Statistics <strong>of</strong> the United States, Colonial<br />
Times to 1975.