- Page 1 and 2:
IHP-VI, Series on Groundwater No. 1
- Page 3 and 4:
Organising Committee Francis Luck,
- Page 5 and 6:
Preface The principle objective beh
- Page 7 and 8:
ASR well field optimization in unco
- Page 9 and 10:
9 TOPIC 3. Modelling aspects and gr
- Page 11 and 12:
11 The impact of alternating redox
- Page 13 and 14:
13 Evaluation of infiltration veloc
- Page 15 and 16:
TOPIC 1 Recharge systems River/lake
- Page 17 and 18:
18 TOPIC 1 Recharge systems / River
- Page 19 and 20:
20 TOPIC 1 Recharge systems / River
- Page 21 and 22:
22 TOPIC 1 Recharge systems / River
- Page 23 and 24:
24 TOPIC 1 Recharge systems / River
- Page 25 and 26:
26 TOPIC 1 Recharge systems / River
- Page 27 and 28:
28 TOPIC 1 Recharge systems / River
- Page 29 and 30:
30 TOPIC 1 Recharge systems / River
- Page 31 and 32:
32 TOPIC 1 Recharge systems / River
- Page 33 and 34:
TOPIC 1 34 Recharge systems / River
- Page 35 and 36:
36 TOPIC 1 Recharge systems / River
- Page 37 and 38:
38 TOPIC 1 Recharge systems / River
- Page 39 and 40:
40 TOPIC 1 Recharge systems / River
- Page 41 and 42:
42 TOPIC 1 Recharge systems / River
- Page 43 and 44:
44 TOPIC 1 Recharge systems / River
- Page 45 and 46:
46 TOPIC 1 Recharge systems / River
- Page 47 and 48:
TOPIC 1 48 Recharge systems / River
- Page 49 and 50:
50 TOPIC 1 Recharge systems / River
- Page 51 and 52:
52 TOPIC 1 Recharge systems / River
- Page 53 and 54:
54 TOPIC 1 Recharge systems / River
- Page 55 and 56:
56 TOPIC 1 Recharge systems / River
- Page 57 and 58:
58 TOPIC 1 Recharge systems / River
- Page 59 and 60:
60 TOPIC 1 Recharge systems / River
- Page 61 and 62:
62 TOPIC 1 Recharge systems / River
- Page 63 and 64:
64 TOPIC 1 Recharge systems / River
- Page 65 and 66:
66 TOPIC 1 Recharge systems / River
- Page 67 and 68:
68 TOPIC 1 Recharge systems / River
- Page 69 and 70:
70 TOPIC 1 Recharge systems / River
- Page 71 and 72:
72 TOPIC 1 Recharge systems / River
- Page 73 and 74:
74 TOPIC 1 Recharge systems / Injec
- Page 75 and 76:
76 TOPIC 1 Recharge systems / Injec
- Page 77 and 78:
78 TOPIC 1 Recharge systems / Injec
- Page 79 and 80:
80 TOPIC 1 Recharge systems / Injec
- Page 81 and 82:
82 TOPIC 1 Recharge systems / Injec
- Page 83 and 84:
84 TOPIC 1 Recharge systems / Injec
- Page 85 and 86:
86 TOPIC 1 Recharge systems / Injec
- Page 87 and 88:
88 TOPIC 1 Recharge systems / Injec
- Page 89 and 90:
90 TOPIC 1 Recharge systems / Injec
- Page 91 and 92:
92 TOPIC 1 Recharge systems / Injec
- Page 93 and 94:
94 TOPIC 1 Recharge systems / Injec
- Page 95 and 96:
96 TOPIC 1 Recharge systems / Injec
- Page 97 and 98:
98 TOPIC 1 Recharge systems / Injec
- Page 99 and 100:
100 TOPIC 1 Recharge systems / Inje
- Page 101 and 102:
102 TOPIC 1 Recharge systems / Inje
- Page 103 and 104:
104 TOPIC 1 Recharge systems / Inje
- Page 105 and 106:
106 TOPIC 1 Recharge systems / Inje
- Page 107 and 108:
108 TOPIC 1 Recharge systems / Inje
- Page 109 and 110:
110 TOPIC 1 Recharge systems / Inje
- Page 111 and 112:
112 TOPIC 1 Recharge systems / Inje
- Page 113 and 114:
114 TOPIC 1 Recharge systems / Inje
- Page 115 and 116:
116 TOPIC 1 Recharge systems / Inje
- Page 117 and 118:
118 TOPIC 1 Recharge systems / Inje
- Page 119 and 120:
120 TOPIC 1 Recharge systems / Inje
- Page 121 and 122:
122 TOPIC 1 Recharge systems / Inje
- Page 123 and 124:
124 TOPIC 1 Recharge systems / Inje
- Page 125 and 126:
126 TOPIC 1 Recharge systems / Inje
- Page 127 and 128:
128 TOPIC 1 Recharge systems / Inje
- Page 129 and 130:
130 TOPIC 1 Recharge systems / Inje
- Page 131 and 132:
132 TOPIC 1 Recharge systems / Inje
- Page 133 and 134:
134 TOPIC 1 Recharge systems / Inje
- Page 135 and 136:
136 TOPIC 1 Recharge systems / Inje
- Page 137 and 138:
138 TOPIC 1 Recharge systems / Inje
- Page 139 and 140:
140 TOPIC 1 Recharge systems / Inje
- Page 141 and 142:
142 TOPIC 1 Recharge systems / Inje
- Page 143 and 144:
144 TOPIC 1 Recharge systems / Inje
- Page 145 and 146:
146 TOPIC 1 Recharge systems / Inje
- Page 147 and 148:
148 TOPIC 1 Recharge systems / Inje
- Page 149 and 150:
150 TOPIC 1 Recharge systems / Inje
- Page 151 and 152:
152 TOPIC 1 Recharge systems / Inje
- Page 153 and 154:
154 TOPIC 1 Recharge systems / Inje
- Page 155 and 156:
156 TOPIC 1 Recharge systems / Inje
- Page 157 and 158:
158 TOPIC 1 Recharge systems / Inje
- Page 159 and 160:
V Review of effects of drilling and
- Page 161 and 162:
162 TOPIC 1 Recharge systems / Inje
- Page 163 and 164:
V Water quality changes during Aqui
- Page 165 and 166:
166 TOPIC 1 Recharge systems / Inje
- Page 167 and 168:
168 TOPIC 1 Recharge systems / Inje
- Page 169 and 170:
170 TOPIC 1 Recharge systems / Inje
- Page 171 and 172:
172 TOPIC 1 Recharge systems / Inje
- Page 173 and 174:
V Proposed scheme for a natural soi
- Page 175 and 176:
176 TOPIC 1 Recharge systems / Alte
- Page 177 and 178:
178 TOPIC 1 Recharge systems / Alte
- Page 179 and 180:
TOPIC 1 Alternative recharge system
- Page 181 and 182:
TOPIC 1 Alternative recharge system
- Page 183 and 184:
TOPIC 1 Alternative recharge system
- Page 185 and 186:
TOPIC 1 Alternative recharge system
- Page 187 and 188:
TOPIC 1 Alternative recharge system
- Page 189 and 190:
TOPIC 1 Alternative recharge system
- Page 191 and 192:
TOPIC 1 Alternative recharge system
- Page 193 and 194:
TOPIC 1 Alternative recharge system
- Page 195 and 196:
TOPIC 1 Alternative recharge system
- Page 197 and 198:
TOPIC 1 Alternative recharge system
- Page 199 and 200:
TOPIC 1 Alternative recharge system
- Page 201 and 202:
TOPIC 1 Alternative recharge system
- Page 203 and 204:
TOPIC 1 Alternative recharge system
- Page 205 and 206:
TOPIC 1 Alternative recharge system
- Page 207 and 208:
TOPIC 1 Alternative recharge system
- Page 209 and 210:
TOPIC 1 Alternative recharge system
- Page 211 and 212:
TOPIC 1 Alternative recharge system
- Page 213 and 214:
TOPIC 1 Alternative recharge system
- Page 215 and 216:
TOPIC 1 Alternative recharge system
- Page 217 and 218:
TOPIC 1 Alternative recharge system
- Page 219 and 220:
TOPIC 1 Alternative recharge system
- Page 221 and 222:
V Roof-top rain water harvesting to
- Page 223 and 224:
TOPIC 1 Alternative recharge system
- Page 225 and 226:
TOPIC 1 Alternative recharge system
- Page 227 and 228:
V Assessment of water harvesting an
- Page 229 and 230:
TOPIC 1 Alternative recharge system
- Page 231 and 232:
TOPIC 1 Alternative recharge system
- Page 233 and 234:
TOPIC 1 Alternative recharge system
- Page 235 and 236:
TOPIC 1 Alternative recharge system
- Page 237 and 238:
TOPIC 1 Alternative recharge system
- Page 239 and 240:
TOPIC 1 Alternative recharge system
- Page 241 and 242:
TOPIC 1 Alternative recharge system
- Page 243 and 244:
V A comparison of three methods for
- Page 245 and 246:
TOPIC2 Geochemistry during infiltra
- Page 247 and 248:
TOPIC2 Geochemistry during infiltra
- Page 249 and 250:
V Use of geochemical and isotope pl
- Page 251 and 252:
TOPIC2 Geochemistry during infiltra
- Page 253 and 254:
TOPIC2 Geochemistry during infiltra
- Page 255 and 256:
TOPIC2 Geochemistry during infiltra
- Page 257 and 258:
TOPIC2 Geochemistry during infiltra
- Page 259 and 260:
TOPIC2 Geochemistry during infiltra
- Page 261 and 262:
TOPIC2 Geochemistry during infiltra
- Page 263 and 264:
TOPIC2 Geochemistry during infiltra
- Page 265 and 266:
V Anaerobic ammonia oxidation durin
- Page 267 and 268:
TOPIC2 Geochemistry during infiltra
- Page 269 and 270:
TOPIC2 Geochemistry during infiltra
- Page 271 and 272:
TOPIC2 Geochemistry during infiltra
- Page 273 and 274:
TOPIC2 Geochemistry during infiltra
- Page 275 and 276:
TOPIC2 Geochemistry during infiltra
- Page 277 and 278:
TOPIC2 Geochemistry during infiltra
- Page 279 and 280:
TOPIC2 Geochemistry during infiltra
- Page 281 and 282:
TOPIC2 Geochemistry during infiltra
- Page 283 and 284:
TOPIC2 Geochemistry during infiltra
- Page 285 and 286:
TOPIC2 Geochemistry during infiltra
- Page 287 and 288:
V Hydrochemical evaluation of surfa
- Page 289 and 290:
TOPIC2 Geochemistry during infiltra
- Page 291 and 292:
TOPIC2 Geochemistry during infiltra
- Page 293 and 294:
V Exploring surface- and groundwate
- Page 295 and 296:
TOPIC2 Geochemistry during infiltra
- Page 297 and 298:
TOPIC2 Geochemistry during infiltra
- Page 299 and 300:
TOPIC2 Geochemistry during infiltra
- Page 301 and 302:
TOPIC2 Geochemistry during infiltra
- Page 303 and 304:
TOPIC2 Geochemistry during infiltra
- Page 305 and 306:
TOPIC2 Geochemistry during infiltra
- Page 307 and 308:
V Biological clogging of porous med
- Page 309 and 310:
TOPIC2 Geochemistry during infiltra
- Page 311 and 312:
TOPIC2 Geochemistry during infiltra
- Page 313 and 314:
TOPIC2 Geochemistry during infiltra
- Page 315 and 316:
TOPIC2 Geochemistry during infiltra
- Page 317 and 318:
TOPIC2 Geochemistry during infiltra
- Page 319 and 320:
TOPIC2 Geochemistry during infiltra
- Page 321 and 322:
TOPIC2 Geochemistry during infiltra
- Page 323 and 324:
TOPIC2 Geochemistry during infiltra
- Page 325 and 326:
TOPIC 3 Modelling aspects and groun
- Page 327 and 328:
332 TOPIC 3 Modelling aspects and g
- Page 329 and 330:
334 TOPIC 3 Modelling aspects and g
- Page 331 and 332:
336 TOPIC 3 Modelling aspects and g
- Page 333 and 334:
338 TOPIC 3 Modelling aspects and g
- Page 335 and 336:
340 TOPIC 3 Modelling aspects and g
- Page 337 and 338:
V Excess air: a new tracer for arti
- Page 339 and 340:
344 TOPIC 3 Modelling aspects and g
- Page 341 and 342:
346 TOPIC 3 Modelling aspects and g
- Page 343 and 344:
V Colloid transport and deposition
- Page 345 and 346:
350 TOPIC 3 Modelling aspects and g
- Page 347 and 348:
352 TOPIC 3 Modelling aspects and g
- Page 349 and 350:
V Hydrogeochemical changes of seepa
- Page 351 and 352:
356 TOPIC 3 Modelling aspects and g
- Page 353 and 354:
358 TOPIC 3 Modelling aspects and g
- Page 355 and 356:
V Quantifying biogeochemical change
- Page 357 and 358:
362 TOPIC 3 Modelling aspects and g
- Page 359 and 360:
364 TOPIC 3 Modelling aspects and g
- Page 361 and 362:
V Case studies on water infiltratio
- Page 363 and 364:
368 TOPIC 3 Modelling aspects and g
- Page 365 and 366:
370 TOPIC 3 Modelling aspects and g
- Page 367 and 368:
372 TOPIC 3 Modelling aspects and g
- Page 369 and 370:
374 TOPIC 3 Modelling aspects and g
- Page 371 and 372:
376 TOPIC 3 Modelling aspects and g
- Page 373 and 374:
378 TOPIC 3 Modelling aspects and g
- Page 375 and 376:
380 TOPIC 3 Modelling aspects and g
- Page 377 and 378:
382 TOPIC 3 Modelling aspects and g
- Page 379 and 380:
V A coupled transport and reaction
- Page 381 and 382:
386 TOPIC 3 Modelling aspects and g
- Page 383 and 384:
V Simulation modeling of salient ar
- Page 385 and 386:
390 TOPIC 3 Modelling aspects and g
- Page 387 and 388:
392 TOPIC 3 Modelling aspects and g
- Page 389 and 390:
394 TOPIC 3 Modelling aspects and g
- Page 391 and 392:
396 TOPIC 3 Modelling aspects and g
- Page 393 and 394:
398 TOPIC 3 Modelling aspects and g
- Page 395 and 396:
400 TOPIC 3 Modelling aspects and g
- Page 397 and 398:
402 TOPIC 3 Modelling aspects and g
- Page 399 and 400:
V Robustness of microbial treatment
- Page 401 and 402:
406 TOPIC 3 Modelling aspects and g
- Page 403 and 404:
408 TOPIC 3 Modelling aspects and g
- Page 405 and 406:
410 TOPIC 3 Modelling aspects and g
- Page 407 and 408:
412 TOPIC 3 Modelling aspects and g
- Page 409 and 410:
414 TOPIC 3 Modelling aspects and g
- Page 411 and 412:
416 TOPIC 3 Modelling aspects and g
- Page 413 and 414:
418 TOPIC 3 Modelling aspects and g
- Page 415 and 416:
420 TOPIC 3 Modelling aspects and g
- Page 417 and 418:
422 TOPIC 3 Modelling aspects and g
- Page 419 and 420:
424 TOPIC 3 Modelling aspects and g
- Page 421 and 422:
426 TOPIC 3 Modelling aspects and g
- Page 423 and 424:
V Groundwater mathematical modeling
- Page 425 and 426:
430 TOPIC 3 Modelling aspects and g
- Page 427 and 428:
432 TOPIC 3 Modelling aspects and g
- Page 429 and 430:
434 TOPIC 3 Modelling aspects and g
- Page 431 and 432:
436 TOPIC 3 Modelling aspects and g
- Page 433 and 434:
438 TOPIC 3 Modelling aspects and g
- Page 435 and 436:
440 TOPIC 3 Modelling aspects and g
- Page 437 and 438:
442 TOPIC 3 Modelling aspects and g
- Page 439 and 440:
444 TOPIC 3 Modelling aspects and g
- Page 441 and 442:
TOPIC 3 446 Modelling aspects and g
- Page 443 and 444:
448 TOPIC 3 Modelling aspects and g
- Page 445 and 446:
450 TOPIC 3 Modelling aspects and g
- Page 447 and 448:
452 TOPIC 3 Modelling aspects and g
- Page 449 and 450:
454 TOPIC 3 Modelling aspects and g
- Page 451 and 452:
456 TOPIC 3 Modelling aspects and g
- Page 453 and 454:
458 TOPIC 3 Modelling aspects and g
- Page 455 and 456:
460 TOPIC 3 Modelling aspects and g
- Page 457 and 458:
462 TOPIC 3 Modelling aspects and g
- Page 459 and 460:
464 TOPIC 3 Modelling aspects and g
- Page 461 and 462:
466 TOPIC 3 Modelling aspects and g
- Page 463 and 464:
468 TOPIC 3 Modelling aspects and g
- Page 465 and 466:
470 TOPIC 3 Modelling aspects and g
- Page 467 and 468:
472 TOPIC 3 Modelling aspects and g
- Page 469 and 470:
TOPIC 4 Health aspects Pathogens an
- Page 471 and 472:
478 TOPIC 4 Health aspects / Pathog
- Page 473 and 474:
480 TOPIC 4 Health aspects / Pathog
- Page 475 and 476:
482 TOPIC 4 Health aspects / Pathog
- Page 477 and 478:
484 TOPIC 4 Health aspects / Pathog
- Page 479 and 480:
486 TOPIC 4 Health aspects / Pathog
- Page 481 and 482:
488 TOPIC 4 Health aspects / Pathog
- Page 483 and 484:
490 TOPIC 4 Health aspects / Pathog
- Page 485 and 486:
492 TOPIC 4 Health aspects / Pathog
- Page 487 and 488:
494 TOPIC 4 Health aspects / Pathog
- Page 489 and 490:
496 TOPIC 4 Health aspects / Pathog
- Page 491 and 492:
V Simulating bank filtration and ar
- Page 493 and 494:
500 TOPIC 4 Health aspects / Pathog
- Page 495 and 496:
TOPIC 4 502 Health aspects / Pathog
- Page 497 and 498:
V Separation of Cryptosporidium ooc
- Page 499 and 500:
506 TOPIC 4 Health aspects / Pathog
- Page 501 and 502:
508 TOPIC 4 Health aspects / Pathog
- Page 503 and 504:
510 TOPIC 4 Health aspects / Pathog
- Page 505 and 506:
512 TOPIC 4 Health aspects / Pathog
- Page 507 and 508:
514 TOPIC 4 Health aspects / Pathog
- Page 509 and 510:
516 TOPIC 4 Health aspects / Pathog
- Page 511 and 512:
V Interactions of indigenous ground
- Page 513 and 514:
520 TOPIC 4 Health aspects / Pathog
- Page 515 and 516:
522 TOPIC 4 Health aspects / Pathog
- Page 517 and 518:
524 TOPIC 4 Health aspects / Pathog
- Page 519 and 520:
526 TOPIC 4 Health aspects / Pharma
- Page 521 and 522:
528 TOPIC 4 Health aspects / Pharma
- Page 523 and 524:
530 TOPIC 4 Health aspects / Pharma
- Page 525 and 526:
532 TOPIC 4 Health aspects / Pharma
- Page 527 and 528:
534 TOPIC 4 Health aspects / Pharma
- Page 529 and 530:
536 TOPIC 4 Health aspects / Pharma
- Page 531 and 532:
538 TOPIC 4 Health aspects / Pharma
- Page 533 and 534:
540 TOPIC 4 Health aspects / Pharma
- Page 535 and 536:
TOPIC 4 Pharmaceutical active compo
- Page 537 and 538:
TOPIC 4 Pharmaceutical active compo
- Page 539 and 540:
TOPIC 4 Pharmaceutical active compo
- Page 541 and 542:
TOPIC 4 Persistent organic substanc
- Page 543 and 544:
TOPIC 4 Persistent organic substanc
- Page 545 and 546:
TOPIC 4 Persistent organic substanc
- Page 547 and 548:
V Fate of trace organic pollutants
- Page 549 and 550:
TOPIC 4 Persistent organic substanc
- Page 551 and 552:
TOPIC 4 Persistent organic substanc
- Page 553 and 554:
TOPIC 4 Persistent organic substanc
- Page 555 and 556:
TOPIC 4 Persistent organic substanc
- Page 557 and 558:
TOPIC 4 Persistent organic substanc
- Page 559 and 560:
TOPIC 4 Persistent organic substanc
- Page 561 and 562:
TOPIC 4 Persistent organic substanc
- Page 563 and 564:
TOPIC 4 Persistent organic substanc
- Page 565 and 566:
V Fate of wastewater effluent organ
- Page 567 and 568:
TOPIC 4 Persistent organic substanc
- Page 569 and 570:
TOPIC 4 Persistent organic substanc
- Page 571 and 572:
TOPIC 4 Persistent organic substanc
- Page 573 and 574:
V Temperature effects on organics r
- Page 575 and 576:
TOPIC 4 Persistent organic substanc
- Page 577 and 578:
TOPIC 4 Persistent organic substanc
- Page 579 and 580:
TOPIC 4 Persistent organic substanc
- Page 581 and 582:
TOPIC 4 Persistent organic substanc
- Page 583 and 584:
TOPIC 5 Clogging effects
- Page 585 and 586:
594 TOPIC 5 Clogging effects METHOD
- Page 587 and 588:
TOPIC 5 596 Clogging effects centra
- Page 589 and 590:
598 TOPIC 5 Clogging effects this k
- Page 591 and 592:
600 TOPIC 5 Clogging effects (CPOM)
- Page 593 and 594:
602 TOPIC 5 Clogging effects Figure
- Page 595 and 596:
604 TOPIC 5 Clogging effects Table
- Page 597 and 598:
606 TOPIC 5 Clogging effects elsewh
- Page 599 and 600:
608 TOPIC 5 Clogging effects sedime
- Page 601 and 602:
610 TOPIC 5 Clogging effects Solan
- Page 603 and 604:
612 TOPIC 5 Clogging effects period
- Page 605 and 606:
614 TOPIC 5 Clogging effects The re
- Page 607 and 608:
616 TOPIC 5 Clogging effects Figure
- Page 609 and 610:
618 TOPIC 5 Clogging effects From m
- Page 611 and 612:
620 TOPIC 5 Clogging effects 14 0.3
- Page 613 and 614:
622 TOPIC 5 Clogging effects during
- Page 615 and 616:
V Laboratory column study on the ef
- Page 617 and 618:
626 TOPIC 5 Clogging effects Cumula
- Page 619 and 620:
628 TOPIC 5 Clogging effects Figure
- Page 621 and 622:
V Effect of grain size on biologica
- Page 623 and 624:
632 TOPIC 5 Clogging effects sample
- Page 625 and 626:
634 TOPIC 5 Clogging effects 6 5 Po
- Page 627 and 628:
TOPIC 5 Clogging effects 635 ACKNOW
- Page 629 and 630:
V Groundwater resource management o
- Page 631 and 632:
TOPIC 6 Region issues and artificia
- Page 633 and 634:
TOPIC 6 Region issues and artificia
- Page 635 and 636:
TOPIC 6 Region issues and artificia
- Page 637 and 638:
TOPIC 6 Region issues and artificia
- Page 639 and 640:
V Identification of groundwater rec
- Page 641 and 642:
TOPIC 6 Region issues and artificia
- Page 643 and 644:
TOPIC 6 Region issues and artificia
- Page 645 and 646:
TOPIC 6 Region issues and artificia
- Page 647 and 648:
TOPIC 6 Region issues and artificia
- Page 649 and 650:
TOPIC 6 Region issues and artificia
- Page 651 and 652:
TOPIC 6 Region issues and artificia
- Page 653 and 654:
V Improvements in wastewater qualit
- Page 655 and 656:
TOPIC 6 Region issues and artificia
- Page 657 and 658:
TOPIC 6 Region issues and artificia
- Page 659 and 660:
V Underground infiltration system f
- Page 661 and 662:
TOPIC 6 Region issues and artificia
- Page 663 and 664:
TOPIC 6 Region issues and artificia
- Page 665 and 666:
V The ‘careos’ from Alpujarra (
- Page 667 and 668:
TOPIC 6 Region issues and artificia
- Page 669 and 670:
TOPIC 6 Region issues and artificia
- Page 671 and 672:
V Pumping influence on particle tra
- Page 673 and 674:
TOPIC 6 Region issues and artificia
- Page 675 and 676:
TOPIC 6 Region issues and artificia
- Page 677 and 678:
V Basin artificial recharge and gro
- Page 679 and 680:
TOPIC 6 Region issues and artificia
- Page 681 and 682:
TOPIC 6 Region issues and artificia
- Page 683 and 684:
V Investigations of alternative fil
- Page 685 and 686:
TOPIC 6 Region issues and artificia
- Page 687 and 688:
TOPIC 6 Region issues and artificia
- Page 689 and 690:
V Groundwater recharge through cavi
- Page 691 and 692:
TOPIC 6 Region issues and artificia
- Page 693 and 694:
TOPIC 6 Region issues and artificia
- Page 695 and 696:
V Variability and scale factors in
- Page 697 and 698:
TOPIC 6 Region issues and artificia
- Page 699 and 700:
TOPIC 6 Region issues and artificia
- Page 701 and 702:
TOPIC 6 Region issues and artificia
- Page 703 and 704:
TOPIC 6 Region issues and artificia
- Page 705 and 706:
TOPIC 6 Region issues and artificia
- Page 707 and 708:
TOPIC 6 Region issues and artificia
- Page 709 and 710:
TOPIC 6 Region issues and artificia
- Page 711 and 712:
TOPIC 6 Region issues and artificia
- Page 713 and 714:
TOPIC 6 Region issues and artificia
- Page 715 and 716:
TOPIC 6 Region issues and artificia
- Page 717 and 718:
V Experience of capturing flood wat
- Page 719 and 720:
TOPIC 6 Region issues and artificia
- Page 721 and 722:
TOPIC 6 Region issues and artificia
- Page 723 and 724:
V Hydraulic and geochemical charact
- Page 725 and 726:
TOPIC 6 Region issues and artificia
- Page 727 and 728:
TOPIC 6 Region issues and artificia
- Page 729 and 730:
V Evaluation of infiltration veloci
- Page 731 and 732:
TOPIC 6 Region issues and artificia
- Page 733 and 734:
DATA ANALYSIS AND DISCUSSION On-sit
- Page 735 and 736:
TOPIC 6 Region issues and artificia
- Page 737 and 738:
V Infiltration mechanism of artific
- Page 739 and 740:
TOPIC 6 Region issues and artificia
- Page 741 and 742:
TOPIC 6 Region issues and artificia
- Page 743 and 744:
TOPIC 6 Region issues and artificia
- Page 745 and 746:
V Groundwater recharge: Results fro
- Page 747 and 748:
TOPIC 6 Region issues and artificia
- Page 749 and 750:
TOPIC 6 Region issues and artificia
- Page 751 and 752:
V Aquifer re-injection as a low imp
- Page 753 and 754:
TOPIC 6 Region issues and artificia
- Page 755 and 756:
TOPIC 6 Region issues and artificia
- Page 757 and 758:
TOPIC 6 Region issues and artificia
- Page 759 and 760:
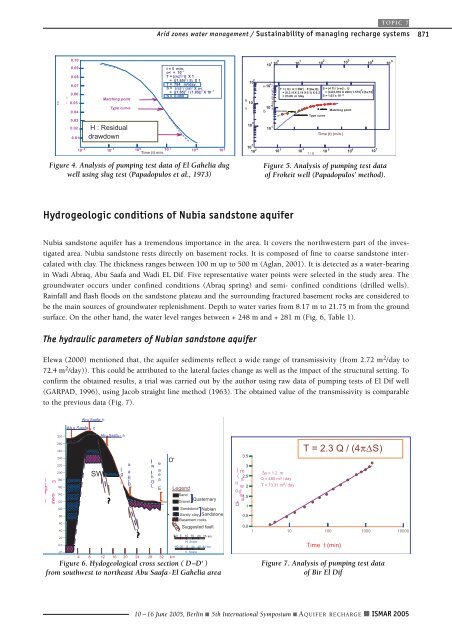
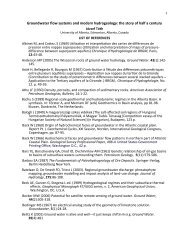
V Sustainability of managing rechar
- Page 761 and 762:
TOPIC 7 MAR strategies / Sustainabi
- Page 763 and 764:
TOPIC 7 MAR strategies / Sustainabi
- Page 765 and 766:
V Application of GIS to aquifer ret
- Page 767 and 768:
TOPIC 7 MAR strategies / Sustainabi
- Page 769 and 770:
TOPIC 7 MAR strategies / Sustainabi
- Page 771 and 772:
V A strategy for optimizing groundw
- Page 773 and 774:
TOPIC 7 MAR strategies / Sustainabi
- Page 775 and 776:
TOPIC 7 MAR strategies / Sustainabi
- Page 777 and 778:
V A methodology for wetland classif
- Page 779 and 780:
TOPIC 7 MAR strategies / Sustainabi
- Page 781 and 782:
TOPIC 7 MAR strategies / Sustainabi
- Page 783 and 784:
TOPIC 7 MAR strategies / Sustainabi
- Page 785 and 786:
UTM Coordinates Morphometry Influen
- Page 787 and 788:
V Use of environmental indicators i
- Page 789 and 790:
TOPIC 7 MAR strategies / Sustainabi
- Page 791 and 792:
TOPIC 7 MAR strategies / Sustainabi
- Page 793 and 794:
TOPIC 7 MAR strategies / Sustainabi
- Page 795 and 796:
V Analysis of feasibility and effec
- Page 797 and 798:
TOPIC 7 MAR strategies / Sustainabi
- Page 799 and 800:
TOPIC 7 MAR strategies / Sustainabi
- Page 801 and 802:
V Developing regulatory controls fo
- Page 803 and 804:
TOPIC 7 MAR strategies / Sustainabi
- Page 805 and 806:
TOPIC 7 MAR strategies / Sustainabi
- Page 807 and 808: V The Streatham groundwater source:
- Page 809 and 810: TOPIC 7 MAR strategies / Sustainabi
- Page 811 and 812: TOPIC 7 MAR strategies / Sustainabi
- Page 813 and 814: V Hydrogeology and water treatment
- Page 815 and 816: TOPIC 7 MAR strategies / Sustainabi
- Page 817 and 818: TOPIC 7 MAR strategies / Sustainabi
- Page 819 and 820: TOPIC 7 MAR strategies / Sustainabi
- Page 821 and 822: V Inexpensive soil amendments to re
- Page 823 and 824: TOPIC 7 MAR strategies / Sustainabi
- Page 825 and 826: TOPIC 7 MAR strategies / Sustainabi
- Page 827 and 828: V Mapping groundwater bodies with a
- Page 829 and 830: TOPIC 7 MAR strategies / Sustainabi
- Page 831 and 832: TOPIC 7 MAR strategies / Sustainabi
- Page 833 and 834: TOPIC 7 MAR strategies / Sustainabi
- Page 835 and 836: TOPIC 7 MAR strategies / Sustainabi
- Page 837 and 838: TOPIC 7 MAR strategies / Sustainabi
- Page 839 and 840: V Wastewater reuse and potentialiti
- Page 841 and 842: TOPIC 7 Water re-use for agricultur
- Page 843 and 844: TOPIC 7 Water re-use for agricultur
- Page 845 and 846: TOPIC 7 Water re-use for agricultur
- Page 847 and 848: TOPIC 7 Water re-use for agricultur
- Page 849 and 850: TOPIC 7 Water re-use for agricultur
- Page 851 and 852: SAN LUIS TOPIC 7 Arid zones water m
- Page 853 and 854: TOPIC 7 Arid zones water management
- Page 855 and 856: TOPIC 7 Arid zones water management
- Page 857: TOPIC 7 Arid zones water management
- Page 861 and 862: TOPIC 7 Arid zones water management
- Page 863 and 864: TOPIC 7 Arid zones water management
- Page 865 and 866: V Large scale recharge modeling in
- Page 867 and 868: TOPIC 7 Arid zones water management
- Page 869 and 870: TOPIC 7 Arid zones water management
- Page 871 and 872: V Investigation of water spreading
- Page 873 and 874: TOPIC 7 Arid zones water management
- Page 875 and 876: V Qanat, a traditional method for w
- Page 877 and 878: TOPIC 7 Arid zones water management
- Page 879 and 880: TOPIC 7 Arid zones water management
- Page 881 and 882: TOPIC 7 Arid zones water management
- Page 883 and 884: Appendix Authors
- Page 885 and 886: 898 APPENDIX Authors / Contact addr
- Page 887 and 888: 900 APPENDIX Authors / Contact addr
- Page 889 and 890: 902 APPENDIX Authors / Contact addr
- Page 891 and 892: 904 APPENDIX Authors / Contact addr
- Page 893 and 894: 906 APPENDIX Authors / Contact addr
- Page 895 and 896: 908 APPENDIX Authors / Contact addr
- Page 897 and 898: 910 APPENDIX Authors / Index of pag
- Page 899 and 900: 912 APPENDIX Authors / Index of pag
- Page 901: Recharge Systems for Protecting and