Annual report 2012 - VDL
Annual report 2012 - VDL
Annual report 2012 - VDL

You also want an ePaper? Increase the reach of your titles
YUMPU automatically turns print PDFs into web optimized ePapers that Google loves.
Financial<br />
highlights<br />
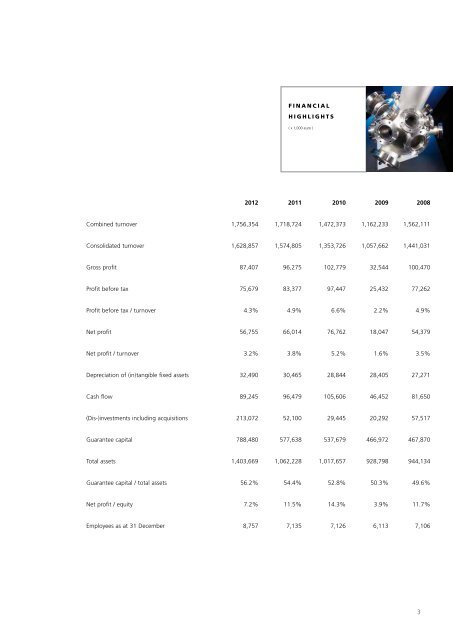
( x 1,000 euro )<br />
<strong>2012</strong> 2011 2010 2009 2008<br />
Combined turnover 1,756,354 1,718,724 1,472,373 1,162,233 1,562,111<br />
Consolidated turnover 1,628,857 1,574,805 1,353,726 1,057,662 1,441,031<br />
Gross profit 87,407 96,275 102,779 32,544 100,470<br />
Profit before tax 75,679 83,377 97,447 25,432 77,262<br />
Profit before tax / turnover 4.3% 4.9% 6.6% 2.2% 4.9%<br />
Net profit 56,755 66,014 76,762 18,047 54,379<br />
Net profit / turnover 3.2% 3.8% 5.2% 1.6% 3.5%<br />
Depreciation of (in)tangible fixed assets 32,490 30,465 28,844 28,405 27,271<br />
Cash flow 89,245 96,479 105,606 46,452 81,650<br />
(Dis-)investments including acquisitions 213,072 52,100 29,445 20,292 57,517<br />
Guarantee capital 788,480 577,638 537,679 466,972 467,870<br />
Total assets 1,403,669 1,062,228 1,017,657 928,798 944,134<br />
Guarantee capital / total assets 56.2% 54.4% 52.8% 50.3% 49.6%<br />
Net profit / equity 7.2% 11.5% 14.3% 3.9% 11.7%<br />
Employees as at 31 December 8,757 7,135 7,126 6,113 7,106<br />
3