Country Economic Work for Malaysia - Islamic Development Bank
Country Economic Work for Malaysia - Islamic Development Bank
Country Economic Work for Malaysia - Islamic Development Bank

Create successful ePaper yourself
Turn your PDF publications into a flip-book with our unique Google optimized e-Paper software.
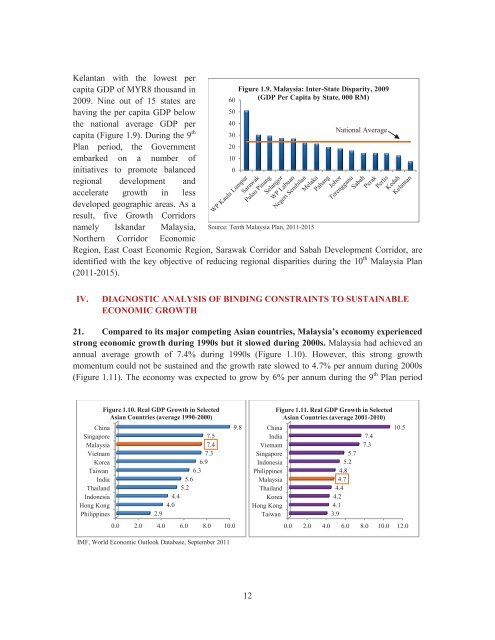
Kelantan with the lowest per<br />
capita GDP of MYR8 thousand in<br />
2009. Nine out of 15 states are<br />
having the per capita GDP below<br />
the national average GDP per<br />
capita (Figure 1.9). During the 9 th<br />
Plan period, the Government<br />
embarked on a number of<br />
initiatives to promote balanced<br />
regional development and<br />
accelerate growth in less<br />
developed geographic areas. As a<br />
result, five Growth Corridors<br />
namely Iskandar <strong>Malaysia</strong>,<br />
Northern Corridor <strong>Economic</strong><br />
60<br />
50<br />
40<br />
30<br />
20<br />
10<br />
0<br />
Figure 1.9. <strong>Malaysia</strong>: Inter-State Disparity, 2009<br />
(GDP Per Capita by State, 000 RM)<br />
Source: Tenth <strong>Malaysia</strong> Plan, 2011-2015<br />
National Average<br />
Region, East Coast <strong>Economic</strong> Region, Sarawak Corridor and Sabah <strong>Development</strong> Corridor, are<br />
identified with the key objective of reducing regional disparities during the 10 th <strong>Malaysia</strong> Plan<br />
(2011-2015).<br />
IV.<br />
DIAGNOSTIC ANALYSIS OF BINDING CONSTRAINTS TO SUSTAINABLE<br />
ECONOMIC GROWTH<br />
21. Compared to its major competing Asian countries, <strong>Malaysia</strong>’s economy experienced<br />
strong economic growth during 1990s but it slowed during 2000s. <strong>Malaysia</strong> had achieved an<br />
annual average growth of 7.4% during 1990s (Figure 1.10). However, this strong growth<br />
momentum could not be sustained and the growth rate slowed to 4.7% per annum during 2000s<br />
(Figure 1.11). The economy was expected to grow by 6% per annum during the 9 th Plan period<br />
China<br />
Singapore<br />
<strong>Malaysia</strong><br />
Vietnam<br />
Korea<br />
Taiwan<br />
India<br />
Thailand<br />
Indonesia<br />
Hong Kong<br />
Philippines<br />
Figure 1.10. Real GDP Growth in Selected<br />
Asian Countries (average 1990-2000)<br />
2.9<br />
7.5<br />
7.4<br />
7.3<br />
6.9<br />
6.3<br />
5.6<br />
5.2<br />
4.4<br />
4.0<br />
0.0 2.0 4.0 6.0 8.0 10.0<br />
9.8<br />
China<br />
India<br />
Vietnam<br />
Singapore<br />
Indonesia<br />
Philippines<br />
<strong>Malaysia</strong><br />
Thailand<br />
Korea<br />
Hong Kong<br />
Taiwan<br />
Figure 1.11. Real GDP Growth in Selected<br />
Asian Countries (average 2001-2010)<br />
5.7<br />
5.2<br />
4.8<br />
4.7<br />
4.4<br />
4.2<br />
4.1<br />
3.9<br />
7.4<br />
7.3<br />
10.5<br />
0.0 2.0 4.0 6.0 8.0 10.0 12.0<br />
IMF, World <strong>Economic</strong> Outlook Database, September 2011<br />
12