Country Economic Work for Malaysia - Islamic Development Bank
Country Economic Work for Malaysia - Islamic Development Bank
Country Economic Work for Malaysia - Islamic Development Bank

You also want an ePaper? Increase the reach of your titles
YUMPU automatically turns print PDFs into web optimized ePapers that Google loves.
that the Government’s <strong>Economic</strong> Trans<strong>for</strong>mation Program with an amount of MYR1.4 trillion<br />
($523 billion) has targeted (92% of total investment) by the private sector (out of total, 73% by<br />
the local private investors and 27% by the <strong>for</strong>eign investors).<br />
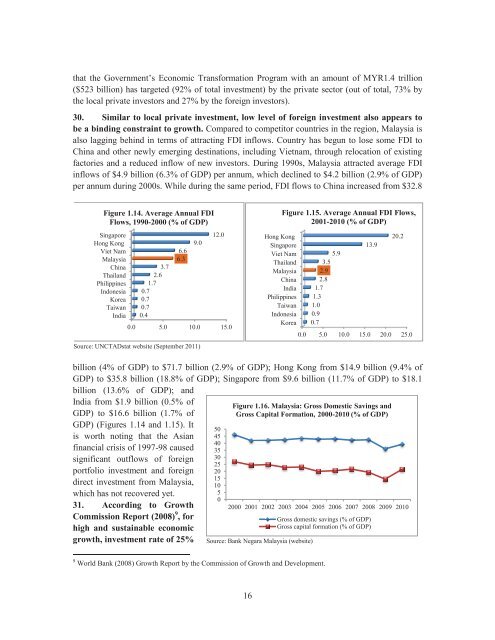
30. Similar to local private investment, low level of <strong>for</strong>eign investment also appears to<br />
be a binding constraint to growth. Compared to competitor countries in the region, <strong>Malaysia</strong> is<br />
also lagging behind in terms of attracting FDI inflows. <strong>Country</strong> has begun to lose some FDI to<br />
China and other newly emerging destinations, including Vietnam, through relocation of existing<br />
factories and a reduced inflow of new investors. During 1990s, <strong>Malaysia</strong> attracted average FDI<br />
inflows of $4.9 billion (6.3% of GDP) per annum, which declined to $4.2 billion (2.9% of GDP)<br />
per annum during 2000s. While during the same period, FDI flows to China increased from $32.8<br />
Figure 1.14. Average Annual FDI<br />
Flows, 1990-2000 (% of GDP)<br />
Singapore<br />
Hong Kong<br />
Viet Nam<br />
<strong>Malaysia</strong><br />
China<br />
Thailand<br />
Philippines<br />
Indonesia<br />
Korea<br />
Taiwan<br />
India<br />
3.7<br />
2.6<br />
1.7<br />
0.7<br />
0.7<br />
0.7<br />
0.4<br />
6.6<br />
6.3<br />
9.0<br />
0.0 5.0 10.0 15.0<br />
Source: UNCTADstat website (September 2011)<br />
12.0<br />
Hong Kong<br />
Singapore<br />
Viet Nam<br />
Thailand<br />
<strong>Malaysia</strong><br />
China<br />
India<br />
Philippines<br />
Taiwan<br />
Indonesia<br />
Korea<br />
Figure 1.15. Average Annual FDI Flows,<br />
2001-2010 (% of GDP)<br />
5.9<br />
3.5<br />
2.9<br />
2.8<br />
1.7<br />
1.3<br />
1.0<br />
0.9<br />
0.7<br />
13.9<br />
20.2<br />
0.0 5.0 10.0 15.0 20.0 25.0<br />
billion (4% of GDP) to $71.7 billion (2.9% of GDP); Hong Kong from $14.9 billion (9.4% of<br />
GDP) to $35.8 billion (18.8% of GDP); Singapore from $9.6 billion (11.7% of GDP) to $18.1<br />
billion (13.6% of GDP); and<br />
India from $1.9 billion (0.5% of<br />
GDP) to $16.6 billion (1.7% of<br />
GDP) (Figures 1.14 and 1.15). It<br />
is worth noting that the Asian<br />
financial crisis of 1997-98 caused<br />
significant outflows of <strong>for</strong>eign<br />
portfolio investment and <strong>for</strong>eign<br />
direct investment from <strong>Malaysia</strong>,<br />
which has not recovered yet.<br />
31. According to Growth<br />
Commission Report (2008) 9 , <strong>for</strong><br />
high and sustainable economic<br />
growth, investment rate of 25%<br />
50<br />
45<br />
40<br />
35<br />
30<br />
25<br />
20<br />
15<br />
10<br />
5<br />
0<br />
Figure 1.16. <strong>Malaysia</strong>: Gross Domestic Savings and<br />
Gross Capital Formation, 2000-2010 (% of GDP)<br />
2000 2001 2002 2003 2004 2005 2006 2007 2008 2009 2010<br />
Source: <strong>Bank</strong> Negara <strong>Malaysia</strong> (website)<br />
Gross domestic savings (% of GDP)<br />
Gross capital <strong>for</strong>mation (% of GDP)<br />
9 World <strong>Bank</strong> (2008) Growth Report by the Commission of Growth and <strong>Development</strong>.<br />
16