Country Economic Work for Malaysia - Islamic Development Bank
Country Economic Work for Malaysia - Islamic Development Bank
Country Economic Work for Malaysia - Islamic Development Bank

You also want an ePaper? Increase the reach of your titles
YUMPU automatically turns print PDFs into web optimized ePapers that Google loves.
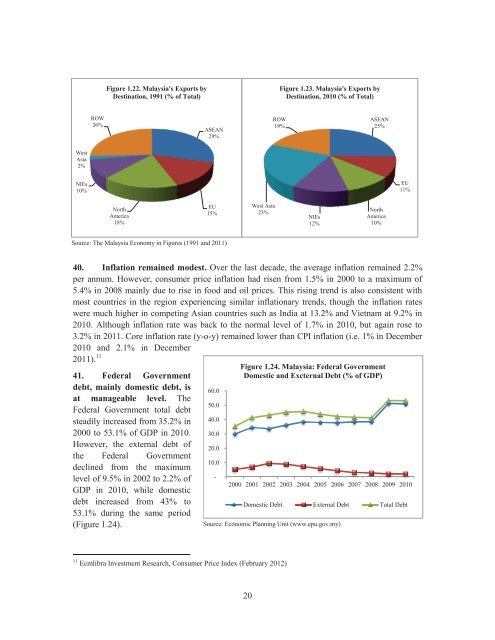
Figure 1.22. <strong>Malaysia</strong>'s Exports by<br />
Destination, 1991 (% of Total)<br />
Figure 1.23. <strong>Malaysia</strong>'s Exports by<br />
Destination, 2010 (% of Total)<br />
ROW<br />
26%<br />
ASEAN<br />
29%<br />
ROW<br />
19%<br />
ASEAN<br />
25%<br />
West<br />
Asia<br />
2%<br />
NIEs<br />
10%<br />
EU<br />
11%<br />
North<br />
America<br />
18%<br />
EU<br />
15%<br />
West Asia<br />
23%<br />
NIEs<br />
12%<br />
North<br />
America<br />
10%<br />
Source: The <strong>Malaysia</strong> Economy in Figures (1991 and 2011)<br />
40. Inflation remained modest. Over the last decade, the average inflation remained 2.2%<br />
per annum. However, consumer price inflation had risen from 1.5% in 2000 to a maximum of<br />
5.4% in 2008 mainly due to rise in food and oil prices. This rising trend is also consistent with<br />
most countries in the region experiencing similar inflationary trends, though the inflation rates<br />
were much higher in competing Asian countries such as India at 13.2% and Vietnam at 9.2% in<br />
2010. Although inflation rate was back to the normal level of 1.7% in 2010, but again rose to<br />
3.2% in 2011. Core inflation rate (y-o-y) remained lower than CPI inflation (i.e. 1% in December<br />
2010 and 2.1% in December<br />
2011). 11<br />
41. Federal Government<br />
debt, mainly domestic debt, is<br />
at manageable level. The<br />
Federal Government total debt<br />
steadily increased from 35.2% in<br />
2000 to 53.1% of GDP in 2010.<br />
However, the external debt of<br />
the Federal Government<br />
declined from the maximum<br />
level of 9.5% in 2002 to 2.2% of<br />
GDP in 2010, while domestic<br />
debt increased from 43% to<br />
53.1% during the same period<br />
(Figure 1.24).<br />
60.0<br />
50.0<br />
40.0<br />
30.0<br />
20.0<br />
10.0<br />
-<br />
Figure 1.24. <strong>Malaysia</strong>: Federal Government<br />
Domestic and Excternal Debt (% of GDP)<br />
2000 2001 2002 2003 2004 2005 2006 2007 2008 2009 2010<br />
Domestic Debt External Debt Total Debt<br />
Source: <strong>Economic</strong> Planning Unit (www.epu.gov.my)<br />
11 Ecmlibra Investment Research, Consumer Price Index (February 2012)<br />
20