Country Economic Work for Malaysia - Islamic Development Bank
Country Economic Work for Malaysia - Islamic Development Bank
Country Economic Work for Malaysia - Islamic Development Bank

You also want an ePaper? Increase the reach of your titles
YUMPU automatically turns print PDFs into web optimized ePapers that Google loves.
(ii) Low Returns to Investments appears as binding constraint<br />
35. <strong>Malaysia</strong>’s social returns to investment is lower compared to Singapore; China;<br />
Philippines and India while higher than Indonesia, Vietnam, Hong Kong, Thailand and<br />
Korea. Slow economic growth can also be explained by lower returns to economic activity,<br />
which in turn can be on account of low social returns to investment and or low appropriability of<br />
the returns. Social returns (or returns to society) can be affected by the level of investment in<br />
human capital, infrastructure, or public goods that compliment private investment. Inadequate<br />
investment in these complementary factors can lead to low social returns by dampening the<br />
productivity of factors of production and increasing the cost of doing business, which in turn<br />
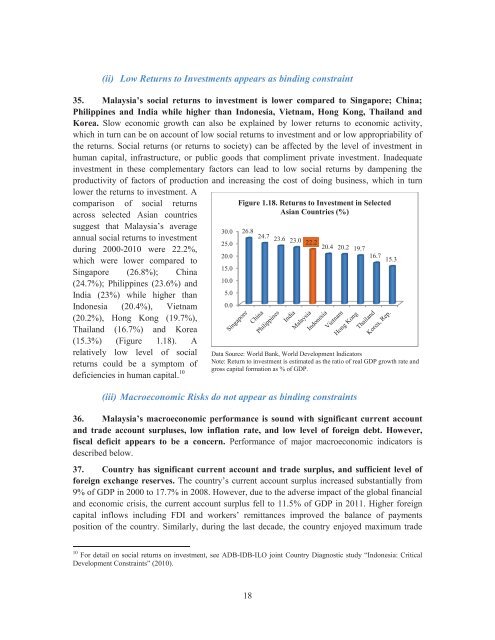
lower the returns to investment. A<br />
comparison of social returns<br />
across selected Asian countries<br />
suggest that <strong>Malaysia</strong>’s average<br />
annual social returns to investment<br />
during 2000-2010 were 22.2%,<br />
which were lower compared to<br />
Singapore (26.8%); China<br />
(24.7%); Philippines (23.6%) and<br />
India (23%) while higher than<br />
Indonesia (20.4%), Vietnam<br />
(20.2%), Hong Kong (19.7%),<br />
Thailand (16.7%) and Korea<br />
(15.3%) (Figure 1.18). A<br />
relatively low level of social<br />
returns could be a symptom of<br />
deficiencies in human capital. 10<br />
30.0 26.8 24.7 23.6 23.0<br />
25.0<br />
22.2 20.4 20.2 19.7<br />
20.0<br />
15.0<br />
10.0<br />
5.0<br />
0.0<br />
Figure 1.18. Returns to Investment in Selected<br />
Asian Countries (%)<br />
16.7 15.3<br />
Data Source: World <strong>Bank</strong>, World <strong>Development</strong> Indicators<br />
Note: Return to investment is estimated as the ratio of real GDP growth rate and<br />
gross capital <strong>for</strong>mation as % of GDP.<br />
(iii) Macroeconomic Risks do not appear as binding constraints<br />
36. <strong>Malaysia</strong>’s macroeconomic per<strong>for</strong>mance is sound with significant current account<br />
and trade account surpluses, low inflation rate, and low level of <strong>for</strong>eign debt. However,<br />
fiscal deficit appears to be a concern. Per<strong>for</strong>mance of major macroeconomic indicators is<br />
described below.<br />
37. <strong>Country</strong> has significant current account and trade surplus, and sufficient level of<br />
<strong>for</strong>eign exchange reserves. The country’s current account surplus increased substantially from<br />
9% of GDP in 2000 to 17.7% in 2008. However, due to the adverse impact of the global financial<br />
and economic crisis, the current account surplus fell to 11.5% of GDP in 2011. Higher <strong>for</strong>eign<br />
capital inflows including FDI and workers’ remittances improved the balance of payments<br />
position of the country. Similarly, during the last decade, the country enjoyed maximum trade<br />
10 For detail on social returns on investment, see ADB-IDB-ILO joint <strong>Country</strong> Diagnostic study “Indonesia: Critical<br />
<strong>Development</strong> Constraints” (2010).<br />
18