New! System-Wide Transit Corridor Plan for the San ... - Omnitrans
New! System-Wide Transit Corridor Plan for the San ... - Omnitrans
New! System-Wide Transit Corridor Plan for the San ... - Omnitrans
You also want an ePaper? Increase the reach of your titles
YUMPU automatically turns print PDFs into web optimized ePapers that Google loves.
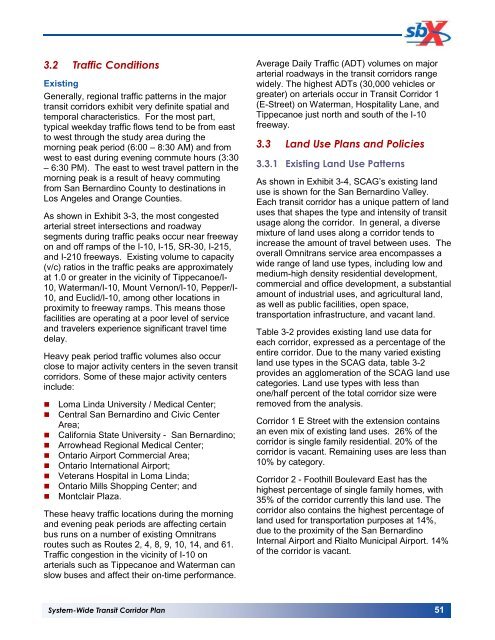
3.2 Traffic Conditions<br />
Existing<br />
Generally, regional traffic patterns in <strong>the</strong> major<br />
transit corridors exhibit very definite spatial and<br />
temporal characteristics. For <strong>the</strong> most part,<br />
typical weekday traffic flows tend to be from east<br />
to west through <strong>the</strong> study area during <strong>the</strong><br />
morning peak period (6:00 – 8:30 AM) and from<br />
west to east during evening commute hours (3:30<br />
– 6:30 PM). The east to west travel pattern in <strong>the</strong><br />
morning peak is a result of heavy commuting<br />
from <strong>San</strong> Bernardino County to destinations in<br />
Los Angeles and Orange Counties.<br />
As shown in Exhibit 3-3, <strong>the</strong> most congested<br />
arterial street intersections and roadway<br />
segments during traffic peaks occur near freeway<br />
on and off ramps of <strong>the</strong> I-10, I-15, SR-30, I-215,<br />
and I-210 freeways. Existing volume to capacity<br />
(v/c) ratios in <strong>the</strong> traffic peaks are approximately<br />
at 1.0 or greater in <strong>the</strong> vicinity of Tippecanoe/I-<br />
10, Waterman/I-10, Mount Vernon/I-10, Pepper/I-<br />
10, and Euclid/I-10, among o<strong>the</strong>r locations in<br />
proximity to freeway ramps. This means those<br />
facilities are operating at a poor level of service<br />
and travelers experience significant travel time<br />
delay.<br />
Heavy peak period traffic volumes also occur<br />
close to major activity centers in <strong>the</strong> seven transit<br />
corridors. Some of <strong>the</strong>se major activity centers<br />
include:<br />
• Loma Linda University / Medical Center;<br />
• Central <strong>San</strong> Bernardino and Civic Center<br />
Area;<br />
• Cali<strong>for</strong>nia State University - <strong>San</strong> Bernardino;<br />
• Arrowhead Regional Medical Center;<br />
• Ontario Airport Commercial Area;<br />
• Ontario International Airport;<br />
• Veterans Hospital in Loma Linda;<br />
• Ontario Mills Shopping Center; and<br />
• Montclair Plaza.<br />
These heavy traffic locations during <strong>the</strong> morning<br />
and evening peak periods are affecting certain<br />
bus runs on a number of existing <strong>Omnitrans</strong><br />
routes such as Routes 2, 4, 8, 9, 10, 14, and 61.<br />
Traffic congestion in <strong>the</strong> vicinity of I-10 on<br />
arterials such as Tippecanoe and Waterman can<br />
slow buses and affect <strong>the</strong>ir on-time per<strong>for</strong>mance.<br />
Average Daily Traffic (ADT) volumes on major<br />
arterial roadways in <strong>the</strong> transit corridors range<br />
widely. The highest ADTs (30,000 vehicles or<br />
greater) on arterials occur in <strong>Transit</strong> <strong>Corridor</strong> 1<br />
(E-Street) on Waterman, Hospitality Lane, and<br />
Tippecanoe just north and south of <strong>the</strong> I-10<br />
freeway.<br />
3.3 Land Use <strong>Plan</strong>s and Policies<br />
3.3.1 Existing Land Use Patterns<br />
As shown in Exhibit 3-4, SCAG’s existing land<br />
use is shown <strong>for</strong> <strong>the</strong> <strong>San</strong> Bernardino Valley.<br />
Each transit corridor has a unique pattern of land<br />
uses that shapes <strong>the</strong> type and intensity of transit<br />
usage along <strong>the</strong> corridor. In general, a diverse<br />
mixture of land uses along a corridor tends to<br />
increase <strong>the</strong> amount of travel between uses. The<br />
overall <strong>Omnitrans</strong> service area encompasses a<br />
wide range of land use types, including low and<br />
medium-high density residential development,<br />
commercial and office development, a substantial<br />
amount of industrial uses, and agricultural land,<br />
as well as public facilities, open space,<br />
transportation infrastructure, and vacant land.<br />
Table 3-2 provides existing land use data <strong>for</strong><br />
each corridor, expressed as a percentage of <strong>the</strong><br />
entire corridor. Due to <strong>the</strong> many varied existing<br />
land use types in <strong>the</strong> SCAG data, table 3-2<br />
provides an agglomeration of <strong>the</strong> SCAG land use<br />
categories. Land use types with less than<br />
one/half percent of <strong>the</strong> total corridor size were<br />
removed from <strong>the</strong> analysis.<br />
<strong>Corridor</strong> 1 E Street with <strong>the</strong> extension contains<br />
an even mix of existing land uses. 26% of <strong>the</strong><br />
corridor is single family residential. 20% of <strong>the</strong><br />
corridor is vacant. Remaining uses are less than<br />
10% by category.<br />
<strong>Corridor</strong> 2 - Foothill Boulevard East has <strong>the</strong><br />
highest percentage of single family homes, with<br />
35% of <strong>the</strong> corridor currently this land use. The<br />
corridor also contains <strong>the</strong> highest percentage of<br />
land used <strong>for</strong> transportation purposes at 14%,<br />
due to <strong>the</strong> proximity of <strong>the</strong> <strong>San</strong> Bernardino<br />
Internal Airport and Rialto Municipal Airport. 14%<br />
of <strong>the</strong> corridor is vacant.<br />
<strong>System</strong>-<strong>Wide</strong> <strong>Transit</strong> <strong>Corridor</strong> <strong>Plan</strong> 51


