Newsletter 02 2006.pdf - Sight and Life
Newsletter 02 2006.pdf - Sight and Life
Newsletter 02 2006.pdf - Sight and Life

Create successful ePaper yourself
Turn your PDF publications into a flip-book with our unique Google optimized e-Paper software.
SIGHT AND LIFE 6<br />
NEWSLETTER 2/2006<br />
• those carried out on reduced<br />
samples of pupils, in particular<br />
a measurement of food-intake<br />
which allowed us to check the<br />
adequacy of the consumption<br />
of gruel actually served (2,573<br />
pupils from 64 classes in 5<br />
schools), serial data-gathering<br />
intended to estimate, amongst<br />
other things, the effects of<br />
gruel consumption on the<br />
frequency <strong>and</strong> composition of<br />
meals (all pupils from 5 of the<br />
15 schools), <strong>and</strong> the share of<br />
nutritional requirements covered<br />
(a survey based on recall<br />
of the past 24 hours carried out<br />
on 480 children from 9 of the<br />
15 schools);<br />
• finally, studies concerning gruel<br />
preparation, which were carried<br />
out in 5 schools to ensure<br />
that preparation guidelines<br />
were being respected <strong>and</strong> to<br />
check the characteristics of the<br />
gruel being served.<br />
Confirmation of the poor<br />
nutritional status <strong>and</strong><br />
low spending power of<br />
pupils<br />
In the first place, the surveys <strong>and</strong><br />
measurements taken allowed us<br />
to confirm the poor nutritional<br />
status of pupils at the start of the<br />
school year, before the Nutrimad<br />
SFP was launched.<br />
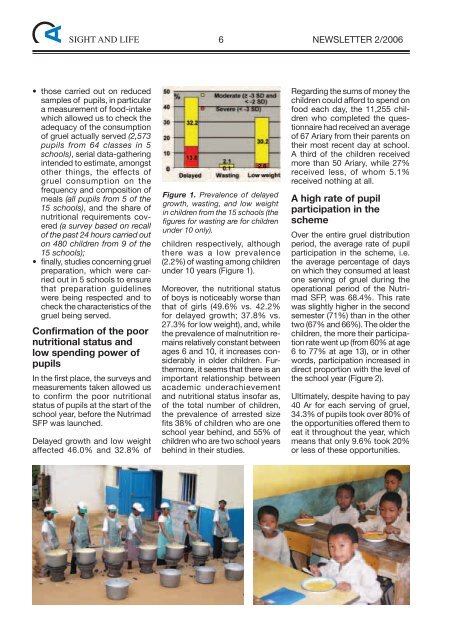
Delayed growth <strong>and</strong> low weight<br />
affected 46.0% <strong>and</strong> 32.8% of<br />
Figure 1. Prevalence of delayed<br />
growth, wasting, <strong>and</strong> low weight<br />
in children from the 15 schools (the<br />
figures for wasting are for children<br />
under 10 only).<br />
children respectively, although<br />
there was a low prevalence<br />
(2.2%) of wasting among children<br />
under 10 years (Figure 1).<br />
Moreover, the nutritional status<br />
of boys is noticeably worse than<br />
that of girls (49.6% vs. 42.2%<br />
for delayed growth; 37.8% vs.<br />
27.3% for low weight), <strong>and</strong>, while<br />
the prevalence of malnutrition remains<br />
relatively constant between<br />
ages 6 <strong>and</strong> 10, it increases considerably<br />
in older children. Furthermore,<br />
it seems that there is an<br />
important relationship between<br />
academic underachievement<br />
<strong>and</strong> nutritional status insofar as,<br />
of the total number of children,<br />
the prevalence of arrested size<br />
fits 38% of children who are one<br />
school year behind, <strong>and</strong> 55% of<br />
children who are two school years<br />
behind in their studies.<br />
Regarding the sums of money the<br />
children could afford to spend on<br />
food each day, the 11,255 children<br />
who completed the questionnaire<br />
had received an average<br />
of 67 Ariary from their parents on<br />
their most recent day at school.<br />
A third of the children received<br />
more than 50 Ariary, while 27%<br />
received less, of whom 5.1%<br />
received nothing at all.<br />
A high rate of pupil<br />
participation in the<br />
scheme<br />
Over the entire gruel distribution<br />
period, the average rate of pupil<br />
participation in the scheme, i.e.<br />
the average percentage of days<br />
on which they consumed at least<br />
one serving of gruel during the<br />
operational period of the Nutrimad<br />
SFP, was 68.4%. This rate<br />
was slightly higher in the second<br />
semester (71%) than in the other<br />
two (67% <strong>and</strong> 66%). The older the<br />
children, the more their participation<br />
rate went up (from 60% at age<br />
6 to 77% at age 13), or in other<br />
words, participation increased in<br />
direct proportion with the level of<br />
the school year (Figure 2).<br />
Ultimately, despite having to pay<br />
40 Ar for each serving of gruel,<br />
34.3% of pupils took over 80% of<br />
the opportunities offered them to<br />
eat it throughout the year, which<br />
means that only 9.6% took 20%<br />
or less of these opportunities.