Newsletter 02 2006.pdf - Sight and Life
Newsletter 02 2006.pdf - Sight and Life
Newsletter 02 2006.pdf - Sight and Life

You also want an ePaper? Increase the reach of your titles
YUMPU automatically turns print PDFs into web optimized ePapers that Google loves.
SIGHT AND LIFE 8<br />
NEWSLETTER 2/2006<br />
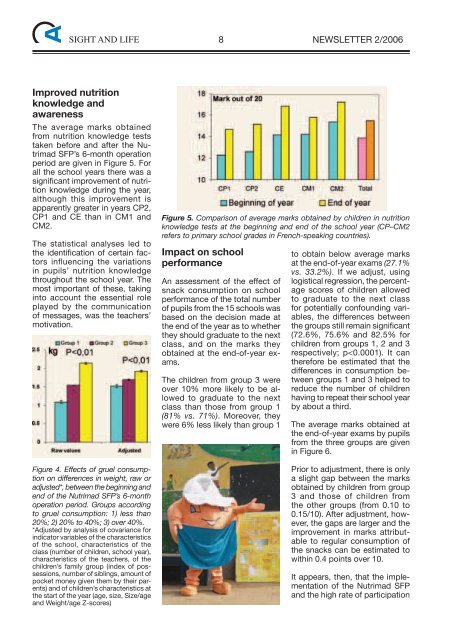
Improved nutrition<br />
knowledge <strong>and</strong><br />
awareness<br />
The average marks obtained<br />
from nutrition knowledge tests<br />
taken before <strong>and</strong> after the Nutrimad<br />
SFP’s 6-month operation<br />
period are given in Figure 5. For<br />
all the school years there was a<br />
significant improvement of nutrition<br />
knowledge during the year,<br />
although this improvement is<br />
apparently greater in years CP2,<br />
CP1 <strong>and</strong> CE than in CM1 <strong>and</strong><br />
CM2.<br />
The statistical analyses led to<br />
the identification of certain factors<br />
influencing the variations<br />
in pupils’ nutrition knowledge<br />
throughout the school year. The<br />
most important of these, taking<br />
into account the essential role<br />
played by the communication<br />
of messages, was the teachers’<br />
motivation.<br />
Figure 4. Effects of gruel consumption<br />
on differences in weight, raw or<br />
adjusted*, between the beginning <strong>and</strong><br />
end of the Nutrimad SFP’s 6-month<br />
operation period. Groups according<br />
to gruel consumption: 1) less than<br />
20%; 2) 20% to 40%; 3) over 40%.<br />
*Adjusted by analysis of covariance for<br />
indicator variables of the characteristics<br />
of the school, characteristics of the<br />
class (number of children, school year),<br />
characteristics of the teachers, of the<br />
children’s family group (index of possessions,<br />
number of siblings, amount of<br />
pocket money given them by their parents)<br />
<strong>and</strong> of children’s characteristics at<br />
the start of the year (age, size, Size/age<br />
<strong>and</strong> Weight/age Z-scores)<br />
Figure 5. Comparison of average marks obtained by children in nutrition<br />
knowledge tests at the beginning <strong>and</strong> end of the school year (CP–CM2<br />
refers to primary school grades in French-speaking countries).<br />
Impact on school<br />
performance<br />
An assessment of the effect of<br />
snack consumption on school<br />
performance of the total number<br />
of pupils from the 15 schools was<br />
based on the decision made at<br />
the end of the year as to whether<br />
they should graduate to the next<br />
class, <strong>and</strong> on the marks they<br />
obtained at the end-of-year exams.<br />
The children from group 3 were<br />
over 10% more likely to be allowed<br />
to graduate to the next<br />
class than those from group 1<br />
(81% vs. 71%). Moreover, they<br />
were 6% less likely than group 1<br />
to obtain below average marks<br />
at the end-of-year exams (27.1%<br />
vs. 33.2%). If we adjust, using<br />
logistical regression, the percentage<br />
scores of children allowed<br />
to graduate to the next class<br />
for potentially confounding variables,<br />
the differences between<br />
the groups still remain significant<br />
(72.6%, 75.6% <strong>and</strong> 82.5% for<br />
children from groups 1, 2 <strong>and</strong> 3<br />
respectively; p