Download - Macro Research - Handelsbanken
Download - Macro Research - Handelsbanken
Download - Macro Research - Handelsbanken

You also want an ePaper? Increase the reach of your titles
YUMPU automatically turns print PDFs into web optimized ePapers that Google loves.
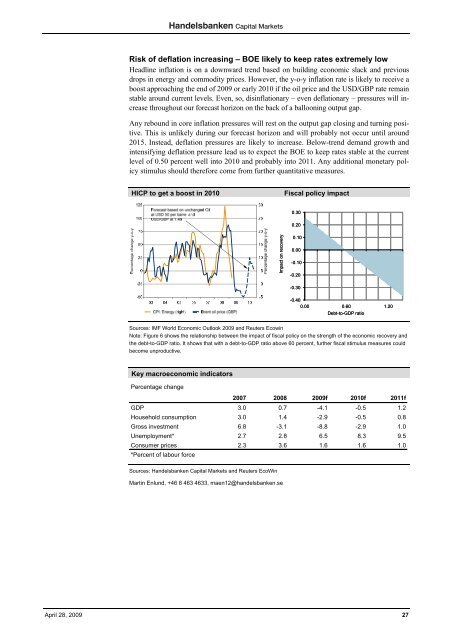
Risk of deflation increasing – BOE likely to keep rates extremely low<br />
Headline inflation is on a downward trend based on building economic slack and previous<br />
drops in energy and commodity prices. However, the y-o-y inflation rate is likely to receive a<br />
boost approaching the end of 2009 or early 2010 if the oil price and the USD/GBP rate remain<br />
stable around current levels. Even, so, disinflationary – even deflationary – pressures will increase<br />
throughout our forecast horizon on the back of a ballooning output gap.<br />
Any rebound in core inflation pressures will rest on the output gap closing and turning positive.<br />
This is unlikely during our forecast horizon and will probably not occur until around<br />
2015. Instead, deflation pressures are likely to increase. Below-trend demand growth and<br />
intensifying deflation pressure lead us to expect the BOE to keep rates stable at the current<br />
level of 0.50 percent well into 2010 and probably into 2011. Any additional monetary policy<br />
stimulus should therefore come from further quantitative measures.<br />
HICP to get a boost in 2010<br />
Fiscal policy impact<br />
0.30<br />
0.20<br />
Impact on recovery<br />
0.10<br />
0.00<br />
-0.10<br />
-0.20<br />
-0.30<br />
-0.40<br />
0.00 0.60 1.20<br />
Debt-to-GDP ratio<br />
Sources: IMF World Economic Outlook 2009 and Reuters Ecowin<br />
Note: Figure 6 shows the relationship between the impact of fiscal policy on the strength of the economic recovery and<br />
the debt-to-GDP ratio. It shows that with a debt-to-GDP ratio above 60 percent, further fiscal stimulus measures could<br />
become unproductive.<br />
Key macroeconomic indicators<br />
Percentage change<br />
2007 2008 2009f 2010f 2011f<br />
GDP 3.0 0.7 -4.1 -0.5 1.2<br />
Household consumption 3.0 1.4 -2.9 -0.5 0.8<br />
Gross investment 6.8 -3.1 -8.8 -2.9 1.0<br />
Unemployment* 2.7 2.8 6.5 8.3 9.5<br />
Consumer prices 2.3 3.6 1.6 1.6 1.0<br />
*Percent of labour force<br />
Sources: <strong>Handelsbanken</strong> Capital Markets and Reuters EcoWin<br />
Martin Enlund, +46 8 463 4633, maen12@handelsbanken.se<br />
April 28, 2009 27