Download - Macro Research - Handelsbanken
Download - Macro Research - Handelsbanken
Download - Macro Research - Handelsbanken

Create successful ePaper yourself
Turn your PDF publications into a flip-book with our unique Google optimized e-Paper software.
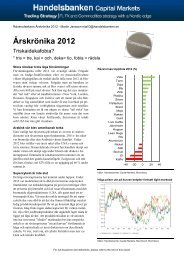
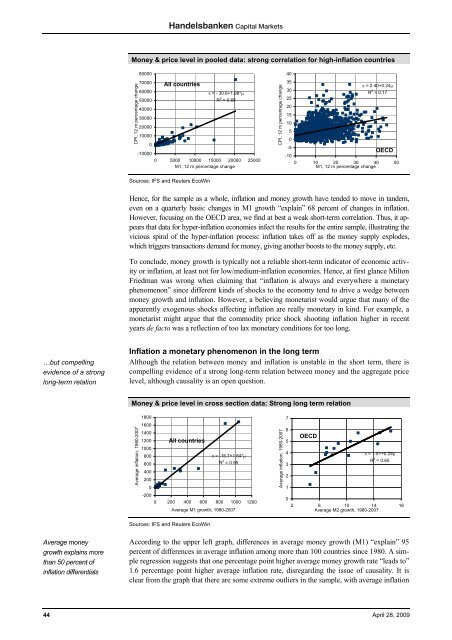
Money & price level in pooled data: strong correlation for high-inflation countries<br />
CPI, 12 m percentage change<br />
80000<br />
70000<br />
60000<br />
50000<br />
40000<br />
30000<br />
20000<br />
10000<br />
0<br />
-10000<br />
All countries<br />
π = - 30.6+1.88*μ<br />
R 2 = 0.68<br />
0 5000 10000 15000 20000 25000<br />
M1, 12 m percentage change<br />
CPI, 12 m percentage change<br />
40<br />
35<br />
30<br />
25<br />
20<br />
15<br />
10<br />
5<br />
0<br />
-5<br />
-10<br />
π = 2.40+0.24μ<br />
R 2 = 0.17<br />
OECD<br />
0 10 20 30 40 50<br />
M1, 12 m percentage change<br />
Sources: IFS and Reuters EcoWin<br />
Hence, for the sample as a whole, inflation and money growth have tended to move in tandem,<br />
even on a quarterly basis: changes in M1 growth “explain” 68 percent of changes in inflation.<br />
However, focusing on the OECD area, we find at best a weak short-term correlation. Thus, it appears<br />
that data for hyper-inflation economies infect the results for the entire sample, illustrating the<br />
vicious spiral of the hyper-inflation process: inflation takes off as the money supply explodes,<br />
which triggers transactions demand for money, giving another boosts to the money supply, etc.<br />
To conclude, money growth is typically not a reliable short-term indicator of economic activity<br />
or inflation, at least not for low/medium-inflation economies. Hence, at first glance Milton<br />
Friedman was wrong when claiming that “inflation is always and everywhere a monetary<br />
phenomenon” since different kinds of shocks to the economy tend to drive a wedge between<br />
money growth and inflation. However, a believing monetarist would argue that many of the<br />
apparently exogenous shocks affecting inflation are really monetary in kind. For example, a<br />
monetarist might argue that the commodity price shock shooting inflation higher in recent<br />
years de facto was a reflection of too lax monetary conditions for too long.<br />
…but compelling<br />
evidence of a strong<br />
long-term relation<br />
Inflation a monetary phenomenon in the long term<br />
Although the relation between money and inflation is unstable in the short term, there is<br />
compelling evidence of a strong long-term relation between money and the aggregate price<br />
level, although causality is an open question.<br />
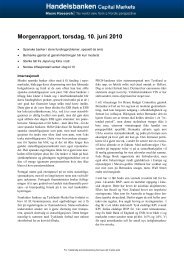
Money & price level in cross section data: Strong long term relation<br />
Average inflation, 1980-2007<br />
1800<br />
1600<br />
1400<br />
1200 All countries<br />
1000<br />
800<br />
π = -15.7+1.64*μ<br />
600<br />
R 2 = 0.95<br />
400<br />
200<br />
0<br />
-200<br />
0 200 400 600 800 1000 1200<br />
Average M1 growth, 1980-2007<br />
Average inflation, 1980-2007<br />
7<br />
6<br />
5<br />
4<br />
3<br />
2<br />
1<br />
0<br />
OECD<br />
π = 1.51+0.29μ<br />
R 2 = 0.65<br />
2 6 10 14 18<br />
Average M2 growth, 1980-2007<br />
Sources: IFS and Reuters EcoWin<br />
Average money<br />
growth explains more<br />
than 50 percent of<br />
inflation differentials<br />
According to the upper left graph, differences in average money growth (M1) “explain” 95<br />
percent of differences in average inflation among more than 100 countries since 1980. A simple<br />
regression suggests that one percentage point higher average money growth rate “leads to”<br />
1.6 percentage point higher average inflation rate, disregarding the issue of causality. It is<br />
clear from the graph that there are some extreme outliers in the sample, with average inflation<br />
44 April 28, 2009