SME Finance Policy Guide
SME Finance Policy Guide
SME Finance Policy Guide

You also want an ePaper? Increase the reach of your titles
YUMPU automatically turns print PDFs into web optimized ePapers that Google loves.
G-20 <strong>SME</strong> FINANCE POLICY GUIDE<br />
87<br />
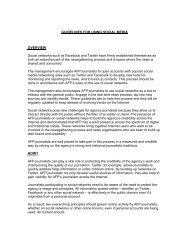
Figure 11 <strong>SME</strong> finance abatement curve<br />
6,000<br />
Probability of<br />
Default<br />
Loss Given Default<br />
Cost Base<br />
Financial institution capacity building<br />
Incremental tax revenues (USD $MM)<br />
5,000<br />
4,000<br />
3,000<br />
2,000<br />
1,000<br />
<strong>SME</strong> capacity building<br />
Financial institution<br />
capacity building<br />
Financial infrastructure:<br />
Institutional component<br />
Financial infrastructure: Related laws and regulations<br />
The steepness of the line indicates<br />
the size of the tax multiplier<br />
Financial infrastructure: Collateral registries<br />
Public support mechanisms<br />
Financial institution capacity building<br />
Financial infrastructure<br />
Public support<br />
mechanisms<br />
0<br />
2,000 4,000 6,000 8,000 10,000 12,000<br />
<strong>SME</strong> finance gap (USD $ MM)<br />
nents can be compared against best-practice benchmarks<br />
to determine the extent of unnecessary cost.<br />
ii) Quantifying the benefits of closing<br />
the “addressable” financing gap<br />
The model next uses multiplier effects to calculate the<br />
second order effects that closing the addressable financing<br />
gap will have in the economy (part of which will<br />
flow back to government in the form of taxes). Given an<br />
acceptable rate of return for the taxpayer, this approach<br />
provides a framework for governing investment in<br />
intervention policies to reduce the <strong>SME</strong> finance gap.<br />
The Oliver Wyman model applied this methodology on<br />
the same six markets examined previously. Given the<br />
uncertainties, the investigators aggregated the results of<br />
the sensitivity analysis into three categories:<br />
• Low (0-15%) – least important driver<br />
• Medium (15% - 50%): driver with significant, but<br />
not primary, impact on the gap<br />
• High (>50%): driver with the greatest likely impact<br />
on the gap<br />
Furthermore, the model only presents the results for<br />
the second order effects of closing the gap (i.e., the<br />
multiplier) at an aggregate level, as given below:<br />
Impact of Drivers on Financing Gap<br />
UK France Morocco Turkey Kenya Philippines<br />
Tax<br />
Multiplier<br />
(average)<br />
“Addressable” gap 13% 32% 45% 115% 82% 229%<br />
Drivers of gap<br />
Probability of default Medium Medium Low High Medium Medium<br />
Loss Given Default high High High Medium High High<br />
Cost base Low Low Medium Low Medium Low<br />
˜0.35<br />
˜0.17<br />
˜0.17<br />
Tax Multiplier<br />
˜0.13 ˜0.17 ˜0.27 ˜0.20 0.31<br />
˜0.45 ˜0.25


![Print a two-page fact sheet on this project [PDF] - IFC](https://img.yumpu.com/43449799/1/190x245/print-a-two-page-fact-sheet-on-this-project-pdf-ifc.jpg?quality=85)