Flexible Design of Airport System Using Real Options Analysis - MIT
Flexible Design of Airport System Using Real Options Analysis - MIT
Flexible Design of Airport System Using Real Options Analysis - MIT

Create successful ePaper yourself
Turn your PDF publications into a flip-book with our unique Google optimized e-Paper software.
12/14/2007<br />
1.231 Planning and <strong>Design</strong> <strong>of</strong> <strong>Airport</strong> <strong>System</strong> Dai Ohama<br />
<strong>of</strong> passengers, capital investment in the future, the operating and maintenance costs, and<br />
unexpected events in the future. For the sake <strong>of</strong> the simplicity, I set only demand <strong>of</strong> the<br />
number <strong>of</strong> passengers as uncertainty.<br />
When forecasting the number <strong>of</strong> passenger in airports,<br />
the time span should be considered at most 20 years span and the volatility, which is the<br />
range <strong>of</strong> the chance the demand is higher or lower, should be considered by plus or minus<br />
50%. [12]<br />
4.3 Demand Forecasting<br />
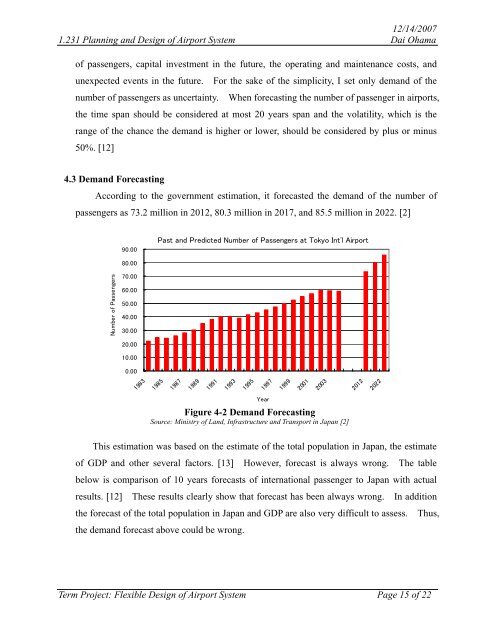
According to the government estimation, it forecasted the demand <strong>of</strong> the number <strong>of</strong><br />
passengers as 73.2 million in 2012, 80.3 million in 2017, and 85.5 million in 2022. [2]<br />
90.00<br />
Past and Predicted Number <strong>of</strong> Passengers at Tokyo Int'l <strong>Airport</strong><br />
80.00<br />
Number <strong>of</strong> Passengers<br />
70.00<br />
60.00<br />
50.00<br />
40.00<br />
30.00<br />
20.00<br />
10.00<br />
0.00<br />
1983<br />
1985<br />
1987<br />
1989<br />
1991<br />
1993<br />
1995<br />
1997<br />
1999<br />
2001<br />
2003<br />
2012<br />
2022<br />
Year<br />
Figure 4-2 Demand Forecasting<br />
Source: Ministry <strong>of</strong> Land, Infrastructure and Transport in Japan [2]<br />
This estimation was based on the estimate <strong>of</strong> the total population in Japan, the estimate<br />
<strong>of</strong> GDP and other several factors. [13] However, forecast is always wrong. The table<br />
below is comparison <strong>of</strong> 10 years forecasts <strong>of</strong> international passenger to Japan with actual<br />
results. [12] These results clearly show that forecast has been always wrong. In addition<br />
the forecast <strong>of</strong> the total population in Japan and GDP are also very difficult to assess. Thus,<br />
the demand forecast above could be wrong.<br />
Term Project: <strong>Flexible</strong> <strong>Design</strong> <strong>of</strong> <strong>Airport</strong> <strong>System</strong> Page 15 <strong>of</strong> 22