Flexible Design of Airport System Using Real Options Analysis - MIT
Flexible Design of Airport System Using Real Options Analysis - MIT
Flexible Design of Airport System Using Real Options Analysis - MIT

You also want an ePaper? Increase the reach of your titles
YUMPU automatically turns print PDFs into web optimized ePapers that Google loves.
12/14/2007<br />
1.231 Planning and <strong>Design</strong> <strong>of</strong> <strong>Airport</strong> <strong>System</strong> Dai Ohama<br />
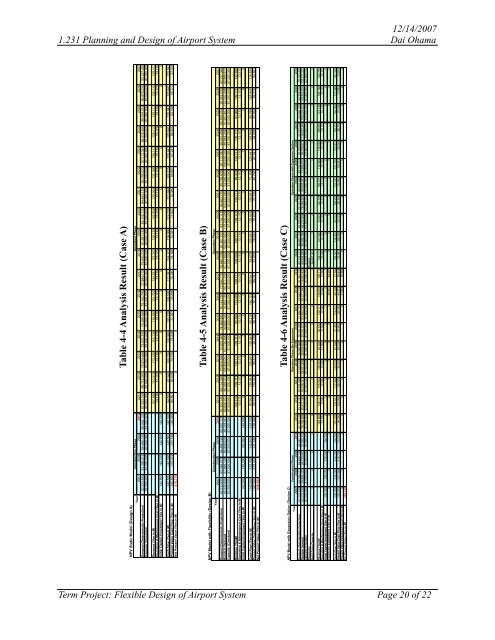
Table 4-4 <strong>Analysis</strong> Result (Case A)<br />
NPV Static Model (<strong>Design</strong> A)<br />
Construction Phase Operation Phase<br />
Year<br />
2010 2007 2008 2009 2011 2012 2013 2014 2015 2016 2017 2018 2019 2020 2021 2022 2023 2024 2025 2026 2027<br />
Demand (Deterministic Projection) 62,233,839 63,366,512 64,486,139 65,592,131 67,353,149 69,114,281 70,874,568 72,633,340 74,389,968 76,143,790 77,894,119 79,640,235 81,381,152 83,116,111 84,463,179 85,795,633 87,113,387 88,416,454 89,704,914 90,978,530 92,237,068<br />
Capacity (Constant) 87,000,000 87,000,000 87,000,000 87,000,000 87,000,000 87,000,000 87,000,000 87,000,000 87,000,000 87,000,000 87,000,000 87,000,000 87,000,000 87,000,000 87,000,000 87,000,000 87,000,000 87,000,000 87,000,000 87,000,000 87,000,000<br />
Revenue (Yen in M) 107,696 110,512 113,326 116,139 118,948 121,752 124,551 127,343 130,126 132,900 135,054 137,185 139,111 139,111 139,111 139,111 139,111<br />
Operating & Maintenance Cost (Yen in M) 13,170 13,170 13,170 13,170 13,170 13,170 13,170 13,170 13,170 13,170 13,170 13,170 13,170 13,170 13,170 13,170 13,170<br />
Initial Capital Investment (Yen in M) 142,500 142,500 142,500 142,500 0 0 0 0 0 0 0 0 0 0 0 0 0 0 0 0 0<br />
Cash Flow (Yen in M) -142,500 -142,500 -142,500 -142,500 94,526 97,342 100,156 102,969 105,778 108,582 111,381 114,173 116,956 119,730 121,884 124,015 125,941 125,941 125,941 125,941 125,941<br />
Present Value Cash Flow (Yen in M) -142,500 -137,019 -131,749 -126,682 80,801 80,008 79,155 78,248 77,291 76,288 75,245 74,164 73,051 71,907 70,385 68,861 67,241 64,655 62,168 59,777 57,478<br />
Net Present Value (Yen in M) 678,770<br />
Table 4-5 <strong>Analysis</strong> Result (Case B)<br />
NPV Model with Flexibility (<strong>Design</strong> B)<br />
Construction Phase Operation Phase<br />
Year<br />
2010 2007 2008 2009 2011 2012 2013 2014 2015 2016 2017 2018 2019 2020 2021 2022 2023 2024 2025 2026 2027<br />
Demand (Deterministic ,131 Projection) 62,233,839 63,366,512 64,486,139 65,592 67,353,149 69,114,281 70,874,568 72,633,340 74,389,968 76,143,790 77,894,119 79,640,235 81,381,152 83,116,111 84,463,179 85,795,633 87,113,387 88,416,454 89,704,914 90,978,530 92,237,068<br />
Random Demand 62 ,233,839 57,868,139 65,908,629 38,319,447 62,649,153 96,258,574 105,906,007 107,792,690 40,892,745 70,852,191 107,971,158 67,571,602 102,961,943 115,202,209 103,423,185 54,083,607 108,556,015 89,944,244 51,261,467 122,025,498 82,989,813<br />
Capacity (Constant) 87,000,000 87,000,000 87,000,000 87,000,000 87,000,000 87,000,000 87,000,000 87,000,000 87,000,000 87,000,000 87,000,000 87,000,000 87,000,000 87,000,000 87,000,000 87,000,000 87,000,000 87,000,000 87,000,000 87,000,000 87,000,000<br />
Revenue (YenM) 100,174 139,111 139,111 139,111 65,386 113,291 139,111 108,045 139,111 139,111 139,111 86,478 139,111 139,111 81,966 139,111 132,698<br />
Operating & Maintenance Cost (Yen in M) 13,170 13,170 13,170 13,170 13,170 13,170 13,170 13,170 13,170 13,170 13,170 13,170 13,170 13,170 13,170 13,170 13,170<br />
Initial Capital Investment (Yen in M) 142,500 142,500 142,500 142,500 0 0 0 0 0 0 0 0 0 0 0 0 0 0 0 0 0<br />
Cash Flow (Yen in M) -142,500 -142,500 -142,500 -142,500 87,004 125,941 125,941 125,941 52,216 100,121 125,941 94,875 125,941 125,941 125,941 73,308 125,941 125,941 68,796 125,941 119,528<br />
Present Value Cash Flow (Yen in M) -142,500 -137,019 -131,749 -126,682 74,372 103,514 99,533 95,705 38,154 70,343 85,081 61,629 78,662 75,637 72,728 40,705 67,241 64,655 33,959 59,777 54,551<br />
Net Present Value (Yen in M) 638,294<br />
Table 4-6 <strong>Analysis</strong> Result (Case C)<br />
NPV Model with Expansion Option (<strong>Design</strong> C)<br />
Ope ration Phase (No Expansion)<br />
Construction Phase Operation Phase with Expansion Optiton<br />
Year<br />
2007 2008 2009 2010 2011 2012 2013 2014 2015 2016 2017 2018 2019 2020 2021 2022 2023 2024 2025 2026 2027 2028 2029 2030<br />
Demand (Deterministic Projection) 62,233,839 63,366,512 64,486,139 65,592 ,131 67,353,149 69,114,281 70,874,568 72,633,340 74,389,968 76,143,790 77,894,119 79,640,235 81,381,152 83,116,111 84,463,179 85,795,633 87,113,387 88,416,454 89,704,914 90,978,530 92,237,068 93,480,029 94,706,438 95,915,430<br />
Random Demand 62,233,839 39,894,335 54,103,487 51,525,702 76,708,558 90,411,186 78,516,141 85,421,842 58,639,900 53,141,813 101,463,792 81,211,366 116,851,429 99,558,999 80,045,196 46,217,658 76,364,557 94,004,581 71,889,072 85,106,617 118,002,960 108,274,523 116,423,514 134,211,221<br />
Ca pacity (<strong>Flexible</strong>) 87,000,000 87,000,000 87,000,000 87,000,000 87,000,000 87,000,000 87,000,000 87,000,000 87,000,000 87,000,000 87,000,000 87,000,000 87,000,000 87,000,000 121,800,000 121,800,000 121,800,000 121,800,000 121,800,000 121,800,000 121,800,000 121,800,000 121,800,000 121,800,000<br />
Expansion Expand<br />
Build Extra Capacity 0 0 0 0 0 0 0 0 0 0 0 0 0 34,800,000 0 0 0 0 0 0 0 0 0 0<br />
Revenue (YenM) 122,655 139,111 125,545 136,587 93,764 84,972 139,111 129,855 139,111 139,111 127,990 73,901 122,105 150,311 114,949 136,083 188,683 173,128 186,158 194,755<br />
Operating & Maintenance Cost (Yen in M) 12,580 12,580 12,580 12,580 12,580 12,580 12,580 12,580 12,580 12,580 13,170 13,170 13,170 13,170 13,170 13,170 13,170 13,170 13,170 13,170<br />
Initial Capital Investment (Yen in M) 126,255 126,255 126,255 126,255 0 0 0 0 0 0 0 0 0 0 0 0 0 0 0 0 0 0 0 0<br />
Expansion Expenditure (Yen in M) 0 0 0 0 0 0 0 0 0 0 0 48,967 48,967 0 0 0 0 0 0 0 0 0 0 0<br />
Cash Flow (Yen in M) -126,255 -126,255 -126,255 -126,255 110,075 126,531 112,965 124,007 81,184 72,392 126,531 68,308 77,564 126,531 114,820 60,731 108,935 137,141 101,779 122,913 175,513 159,958 172,988 181,585<br />
Present Value Cash Flow (Yen in M) -126,255 -121,399 -116,729 -112,240 94,092 103,999 89,278 94,235 59,320 50,862 85,480 44,372 48,446 75,991 66,306 33,722 58,161 70,404 50,241 58,340 80,102 70,195 72,993 73,674<br />
Present Value Expansion Cost (Yen in M) 0 0 0 0 0 0 0 0 0 0 0 31,808 30,584 0 0 0 0 0 0 0 0 0 0 0<br />
Net Present Value (Yen in M) 686,728<br />
Term Project: <strong>Flexible</strong> <strong>Design</strong> <strong>of</strong> <strong>Airport</strong> <strong>System</strong> Page 20 <strong>of</strong> 22