Download PDF - Zoological Studies - Academia Sinica
Download PDF - Zoological Studies - Academia Sinica
Download PDF - Zoological Studies - Academia Sinica

Create successful ePaper yourself
Turn your PDF publications into a flip-book with our unique Google optimized e-Paper software.
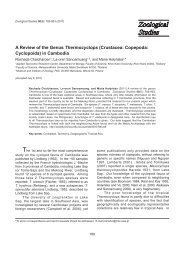
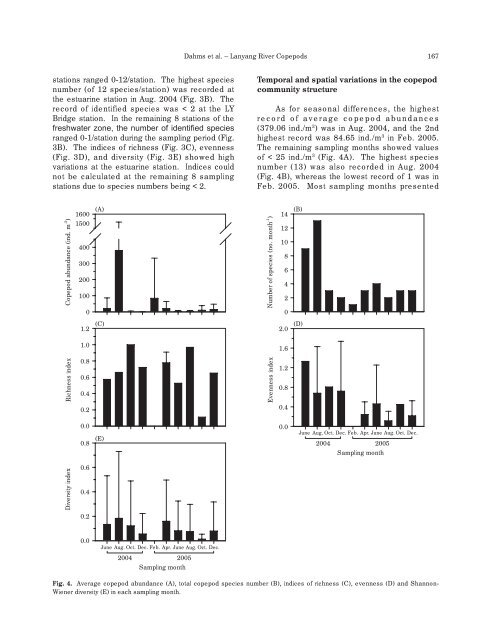
Dahms et al. – Lanyang River Copepods 167<br />
stations ranged 0-12/station. The highest species<br />
number (of 12 species/station) was recorded at<br />
the estuarine station in Aug. 2004 (Fig. 3B). The<br />
record of identified species was < 2 at the LY<br />
Bridge station. In the remaining 8 stations of the<br />
freshwater zone, the number of identified species<br />
ranged 0-1/station during the sampling period (Fig.<br />
3B). The indices of richness (Fig. 3C), evenness<br />
(Fig. 3D), and diversity (Fig. 3E) showed high<br />
variations at the estuarine station. Indices could<br />
not be calculated at the remaining 8 sampling<br />
stations due to species numbers being < 2.<br />
Temporal and spatial variations in the copepod<br />
community structure<br />
As for seasonal differences, the highest<br />
record of average copepod abundances<br />
(379.06 ind./m 3 ) was in Aug. 2004, and the 2nd<br />
highest record was 84.65 ind./m 3 in Feb. 2005.<br />
The remaining sampling months showed values<br />
of < 25 ind./m 3 (Fig. 4A). The highest species<br />
number (13) was also recorded in Aug. 2004<br />
(Fig. 4B), whereas the lowest record of 1 was in<br />
Feb. 2005. Most sampling months presented<br />
Copepod abundance (ind. m -3 )<br />
1600<br />
1500<br />
400<br />
300<br />
200<br />
100<br />
0<br />
(A)<br />
Number of species (no. month -1 )<br />
14<br />
12<br />
10<br />
8<br />
6<br />
4<br />
2<br />
0<br />
(B)<br />
1.2<br />
(C)<br />
2.0<br />
(D)<br />
1.0<br />
1.6<br />
Diversity index Richness index<br />
0.8<br />
0.6<br />
0.4<br />
0.2<br />
0.0<br />
0.8<br />
0.6<br />
0.4<br />
(E)<br />
Evenness index<br />
1.2<br />
0.8<br />
0.4<br />
0.0<br />
June Aug. Oct. Dec. Feb. Apr. June Aug. Oct. Dec.<br />
2004 2005<br />
Sampling month<br />
0.2<br />
0.0<br />
June Aug. Oct. Dec. Feb. Apr. June Aug. Oct. Dec.<br />
2004 2005<br />
Sampling month<br />
Fig. 4. Average copepod abundance (A), total copepod species number (B), indices of richness (C), evenness (D) and Shannon-<br />
Wiener diversity (E) in each sampling month.