Download PDF - Zoological Studies - Academia Sinica
Download PDF - Zoological Studies - Academia Sinica
Download PDF - Zoological Studies - Academia Sinica

Create successful ePaper yourself
Turn your PDF publications into a flip-book with our unique Google optimized e-Paper software.
168 <strong>Zoological</strong> <strong>Studies</strong> 51(2): 160-174 (2012)<br />
communities with < 4 species. Indices of richness<br />
(Fig. 4C), evenness (Fig. 4D), and diversity (Fig.<br />
4E) showed some temporal variability without a<br />
clear trend. There were no significant differences<br />
in abundance, species number, or indices of<br />
richness, evenness, and diversity of copepods<br />
among sampling months (Fig. 4, p > 0.05, one-way<br />
ANOVA).<br />
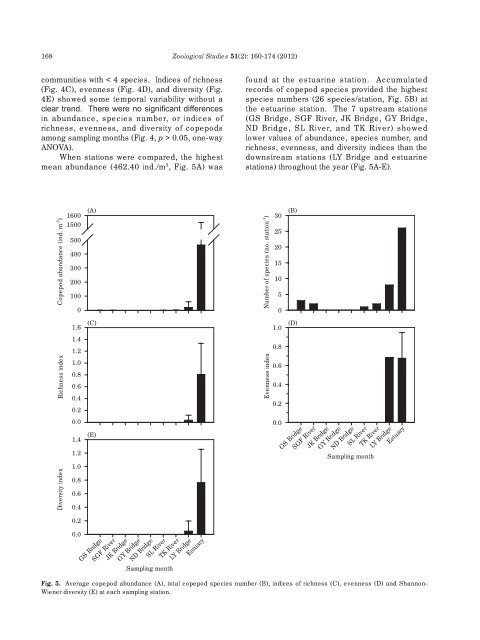
When stations were compared, the highest<br />
mean abundance (462.40 ind./m 3 , Fig. 5A) was<br />
found at the estuarine station. Accumulated<br />
records of copepod species provided the highest<br />
species numbers (26 species/station, Fig. 5B) at<br />
the estuarine station. The 7 upstream stations<br />
(GS Bridge, SGF River, JK Bridge, GY Bridge,<br />
ND Bridge, SL River, and TK River) showed<br />
lower values of abundance, species number, and<br />
richness, evenness, and diversity indices than the<br />
downstream stations (LY Bridge and estuarine<br />
stations) throughout the year (Fig. 5A-E).<br />
Diversity index Richness index<br />
Copepod abundance (ind. m -3 )<br />
1600<br />
1500<br />
500<br />
400<br />
300<br />
200<br />
100<br />
0<br />
1.6<br />
1.4<br />
1.2<br />
1.0<br />
0.8<br />
0.6<br />
0.4<br />
0.2<br />
0.0<br />
1.4<br />
1.2<br />
1.0<br />
0.8<br />
0.6<br />
0.4<br />
0.2<br />
0.0<br />
(A)<br />
(C)<br />
(E)<br />
GS Bridge<br />
SGF River<br />
JK Bridge<br />
GY Bridge<br />
Sampling month<br />
ND Bridge<br />
SL River<br />
TK River<br />
LY Bridge<br />
Estuary<br />
Fig. 5. Average copepod abundance (A), total copepod species number (B), indices of richness (C), evenness (D) and Shannon-<br />
Wiener diversity (E) at each sampling station.<br />
Number of species (no. station -1 )<br />
Evenness index<br />
30<br />
25<br />
20<br />
15<br />
10<br />
5<br />
0<br />
1.0<br />
0.8<br />
0.6<br />
0.4<br />
0.2<br />
0.0<br />
(B)<br />
(D)<br />
GS Bridge<br />
SGF River<br />
JK Bridge<br />
GY Bridge<br />
ND Bridge<br />
SL River<br />
TK River<br />
LY Bridge<br />
Estuary<br />
Sampling month