Vol 87 2010 The Monthly June.pdf - Central Statistical Office of Zambia
Vol 87 2010 The Monthly June.pdf - Central Statistical Office of Zambia
Vol 87 2010 The Monthly June.pdf - Central Statistical Office of Zambia

Create successful ePaper yourself
Turn your PDF publications into a flip-book with our unique Google optimized e-Paper software.
Percentage Changes in GDP by Kind <strong>of</strong> Economic Activity, 2005-2009<br />
KIND OF ECONOMIC ACTIVITY 2005 2006 2007 2008 2009**<br />
(Preliminary)<br />
2009*<br />
(Revised)<br />
Agriculture, Forestry and Fishing (0.6) 2.2 0.4 2.6 7.1 7.2<br />
Mining and Quarrying 7.9 7.3 3.6 2.5 15.8 20.3<br />
PRIMARY SECTOR 2.5 4.1 1.7 2.5 10.5 12.4<br />
Manufacturing 2.9 5.7 3.0 1.8 2.5 2.2<br />
Electricity, Gas and Water 5.4 10.5 1.0 (1.2) 8.6 6.8<br />
Construction 21.2 14.4 20.0 8.7 15.5 9.5<br />
SECONDARY SECTOR 10.0 9.8 10.0 4.7 9.4 6.2<br />
Wholesale and Retail trade 2.4 2.0 2.4 2.7 3.0 2.3<br />
Restaurants, Bars and Hotels 11.7 16.1 9.6 5.0 (14.5) (13.4)<br />
Transport, Storage and Communications 11.0 22.1 19.2 15.8 3.1 7.6<br />
Financial Institutions and Insurance 3.3 4.0 4.1 8.7 5.0 5.2<br />
Real Estate and Business services 3.2 3.2 3.1 3.0 3.1 2.8<br />
Community, Social and Personal Services 11.4 9.0 12.5 11.7 6.8 8.6<br />
TERTIARY SECTOR 5.4 6.7 7.1 7.2 3.0 3.9<br />
Less: FISIM 2.5 2.5 2.5 2.5 2.5 3.3<br />
TOTAL GROSS VALUE ADDED 5.8 7.0 6.7 5.7 6.3 6.4<br />
Taxes less subsidies on Products (0.1) (3.1) (0.3) 5.7 6.3 6.4<br />
TOTAL G.D.P. AT MARKET PRICES 5.3 6.2 6.2 5.7 6.3 6.4<br />
Source: 2009 National Accounts Statistics, CSO<br />
**Preliminary<br />
**Revised<br />
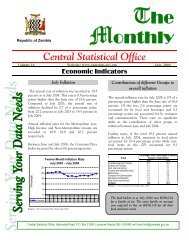
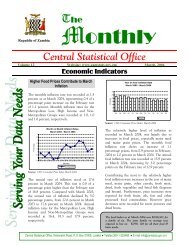
<strong>The</strong> Mining and Quarrying industry grew<br />
by 20.3 percent in 2009, up from only 2.5<br />
percent in 2008. This is mainly due to an<br />
increase in copper output, which<br />
increased by 21.1 percent from 575, 036.8<br />
metric tonnes produced in 2008 to 696,<br />
411.1 metric tonnes in 2009. This is despite<br />
the price <strong>of</strong> copper declining from an<br />
average <strong>of</strong> 315.39 US Cents per pound in<br />
2008 to 233.71 US Cents per pound in<br />
2009.<br />
Trend in Copper Prices in US Cents/lb, 2007-2009<br />
Source: Statistics Fortnightly, Bank <strong>of</strong> <strong>Zambia</strong><br />
24