Vol 87 2010 The Monthly June.pdf - Central Statistical Office of Zambia
Vol 87 2010 The Monthly June.pdf - Central Statistical Office of Zambia
Vol 87 2010 The Monthly June.pdf - Central Statistical Office of Zambia

Create successful ePaper yourself
Turn your PDF publications into a flip-book with our unique Google optimized e-Paper software.
Flow<br />
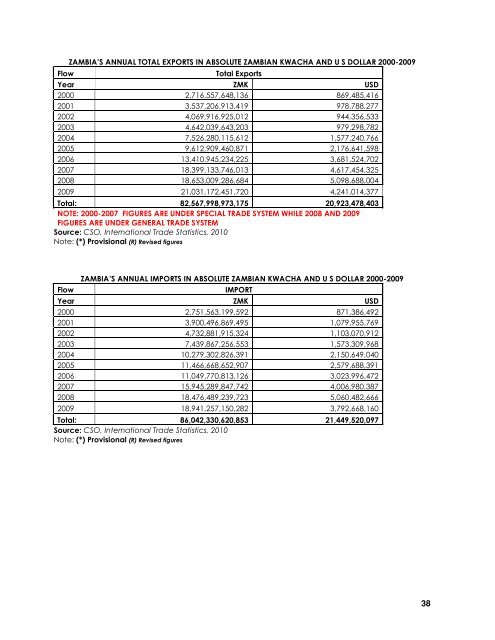
ZAMBIA’S ANNUAL TOTAL EXPORTS IN ABSOLUTE ZAMBIAN KWACHA AND U S DOLLAR 2000-2009<br />
Total Exports<br />
Year ZMK USD<br />
2000 2,716,557,648,136 869,485,416<br />
2001 3,537,206,913,419 978,788,277<br />
2002 4,069,916,925,012 944,356,533<br />
2003 4,642,039,643,203 979,298,782<br />
2004 7,526,280,115,612 1,577,240,766<br />
2005 9,612,909,460,<strong>87</strong>1 2,176,641,598<br />
2006 13,410,945,234,225 3,681,524,702<br />
2007 18,399,133,746,013 4,617,454,325<br />
2008 18,653,009,286,684 5,098,688,004<br />
2009 21,031,172,451,720 4,241,014,377<br />
Total: 82,567,998,973,175 20,923,478,403<br />
NOTE: 2000-2007 FIGURES ARE UNDER SPECIAL TRADE SYSTEM WHILE 2008 AND 2009<br />
FIGURES ARE UNDER GENERAL TRADE SYSTEM<br />
Source: CSO, International Trade Statistics, <strong>2010</strong><br />
Note: (*) Provisional (R) Revised figures<br />
Flow<br />
ZAMBIA’S ANNUAL IMPORTS IN ABSOLUTE ZAMBIAN KWACHA AND U S DOLLAR 2000-2009<br />
IMPORT<br />
Year ZMK USD<br />
2000 2,751,563,199,592 <strong>87</strong>1,386,492<br />
2001 3,900,496,869,495 1,079,955,769<br />
2002 4,732,881,915,324 1,103,070,912<br />
2003 7,439,867,256,553 1,573,309,968<br />
2004 10,279,302,826,391 2,150,649,040<br />
2005 11,466,668,652,907 2,579,688,391<br />
2006 11,049,770,813,126 3,023,996,472<br />
2007 15,945,289,847,742 4,006,980,3<strong>87</strong><br />
2008 18,476,489,239,723 5,060,482,666<br />
2009 18,941,257,150,282 3,792,668,160<br />
Total: 86,042,330,620,853 21,449,520,097<br />
Source: CSO, International Trade Statistics, <strong>2010</strong><br />
Note: (*) Provisional (R) Revised figures<br />
38