(formely M-Cell Limited) - Business Report 2003 - MTN Group
(formely M-Cell Limited) - Business Report 2003 - MTN Group
(formely M-Cell Limited) - Business Report 2003 - MTN Group

You also want an ePaper? Increase the reach of your titles
YUMPU automatically turns print PDFs into web optimized ePapers that Google loves.
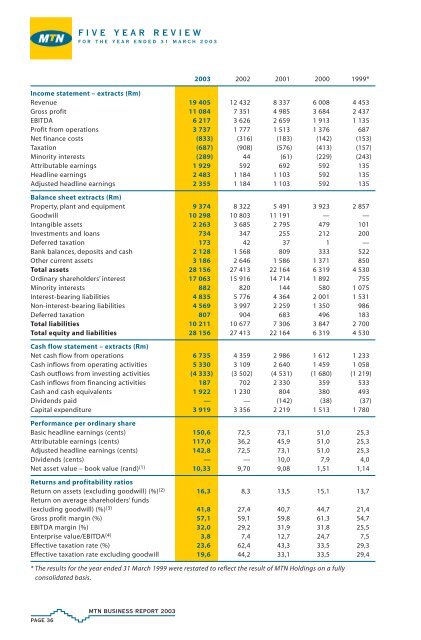
FIVE YEAR REVIEW<br />
FOR THE YEAR ENDED 31 MARCH <strong>2003</strong><br />
<strong>2003</strong> 2002 2001 2000 1999*<br />
Income statement – extracts (Rm)<br />
Revenue 19 405 12 432 8 337 6 008 4 453<br />
Gross profit 11 084 7 351 4 985 3 684 2 437<br />
EBITDA 6 217 3 626 2 659 1 913 1 135<br />
Profit from operations 3 737 1 777 1 513 1 376 687<br />
Net finance costs (833) (316) (183) (142) (153)<br />
Taxation (687) (908) (576) (413) (157)<br />
Minority interests (289) 44 (61) (229) (243)<br />
Attributable earnings 1 929 592 692 592 135<br />
Headline earnings 2 483 1 184 1 103 592 135<br />
Adjusted headline earnings 2 355 1 184 1 103 592 135<br />
Balance sheet extracts (Rm)<br />
Property, plant and equipment 9 374 8 322 5 491 3 923 2 857<br />
Goodwill 10 298 10 803 11 191 — —<br />
Intangible assets 2 263 3 685 2 795 479 101<br />
Investments and loans 734 347 255 212 200<br />
Deferred taxation 173 42 37 1 —<br />
Bank balances, deposits and cash 2 128 1 568 809 333 522<br />
Other current assets 3 186 2 646 1 586 1 371 850<br />
Total assets 28 156 27 413 22 164 6 319 4 530<br />
Ordinary shareholders’ interest 17 063 15 916 14 714 1 892 755<br />
Minority interests 882 820 144 580 1 075<br />
Interest-bearing liabilities 4 835 5 776 4 364 2 001 1 531<br />
Non-interest-bearing liabilities 4 569 3 997 2 259 1 350 986<br />
Deferred taxation 807 904 683 496 183<br />
Total liabilities 10 211 10 677 7 306 3 847 2 700<br />
Total equity and liabilities 28 156 27 413 22 164 6 319 4 530<br />
Cash flow statement – extracts (Rm)<br />
Net cash flow from operations 6 735 4 359 2 986 1 612 1 233<br />
Cash inflows from operating activities 5 330 3 109 2 640 1 459 1 058<br />
Cash outflows from investing activities (4 333) (3 502) (4 531) (1 680) (1 219)<br />
Cash inflows from financing activities 187 702 2 330 359 533<br />
Cash and cash equivalents 1 922 1 230 804 380 493<br />
Dividends paid — — (142) (38) (37)<br />
Capital expenditure 3 919 3 356 2 219 1 513 1 780<br />
Performance per ordinary share<br />
Basic headline earnings (cents) 150,6 72,5 73,1 51,0 25,3<br />
Attributable earnings (cents) 117,0 36,2 45,9 51,0 25,3<br />
Adjusted headline earnings (cents) 142,8 72,5 73,1 51,0 25,3<br />
Dividends (cents) — — 10,0 7,9 4,0<br />
Net asset value – book value (rand) (1) 10,33 9,70 9,08 1,51 1,14<br />
Returns and profitability ratios<br />
Return on assets (excluding goodwill) (%) (2) 16,3 8,3 13,5 15,1 13,7<br />
Return on average shareholders’ funds<br />
(excluding goodwill) (%) (3) 41,8 27,4 40,7 44,7 21,4<br />
Gross profit margin (%) 57,1 59,1 59,8 61,3 54,7<br />
EBITDA margin (%) 32,0 29,2 31,9 31,8 25,5<br />
Enterprise value/EBITDA (4) 3,8 7,4 12,7 24,7 7,5<br />
Effective taxation rate (%) 23,6 62,4 43,3 33,5 29,3<br />
Effective taxation rate excluding goodwill 19,6 44,2 33,1 33,5 29,4<br />
* The results for the year ended 31 March 1999 were restated to reflect the result of <strong>MTN</strong> Holdings on a fully<br />
consolidated basis.<br />
PAGE 36<br />
<strong>MTN</strong> BUSINESS REPORT <strong>2003</strong>