
Create successful ePaper yourself
Turn your PDF publications into a flip-book with our unique Google optimized e-Paper software.
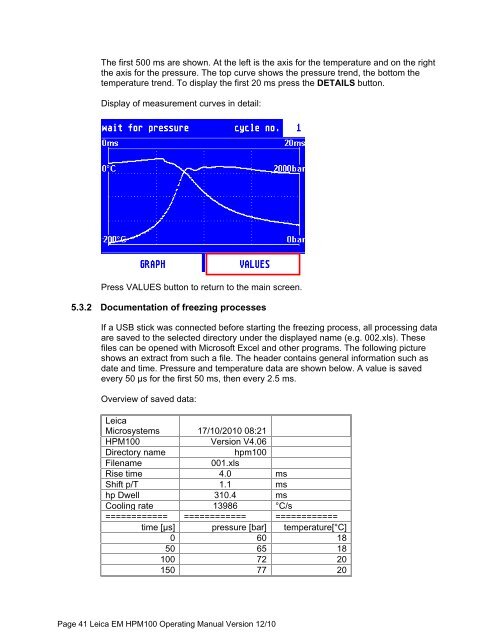
The first 500 ms are shown. At the left is the axis for the temperature and on the right<br />
the axis for the pressure. The top curve shows the pressure trend, the bottom the<br />
temperature trend. To display the first 20 ms press the DETAILS button.<br />
Display of measurement curves in detail:<br />
Press VALUES button to return to the main screen.<br />
5.3.2 Documentation of freezing processes<br />
If a USB stick was connected before starting the freezing process, all processing data<br />
are saved to the selected directory under the displayed name (e.g. 002.xls). These<br />
files can be opened with Microsoft Excel and other programs. The following picture<br />
shows an extract from such a file. The header contains general information such as<br />
date and time. Pressure and temperature data are shown below. A value is saved<br />
every 50 µs for the first 50 ms, then every 2.5 ms.<br />
Overview of saved data:<br />
<strong>Leica</strong><br />
Microsystems 17/10/2010 08:21<br />
<strong>HPM100</strong> Version V4.06<br />
Directory name hpm100<br />
Filename<br />
001.xls<br />
Rise time 4.0 ms<br />
Shift p/T 1.1 ms<br />
hp Dwell 310.4 ms<br />
Cooling rate 13986 °C/s<br />
============ ============ ============<br />
time [µs] pressure [bar] temperature[°C]<br />
0 60 18<br />
50 65 18<br />
100 72 20<br />
150 77 20<br />
Page 41 <strong>Leica</strong> <strong>EM</strong> <strong>HPM100</strong> Operating Manual Version 12/10