RFG Annual Report 2007 - Retail Food Group
RFG Annual Report 2007 - Retail Food Group
RFG Annual Report 2007 - Retail Food Group

You also want an ePaper? Increase the reach of your titles
YUMPU automatically turns print PDFs into web optimized ePapers that Google loves.
06/07<br />
<strong>Annual</strong> <strong>Report</strong><br />
38<br />
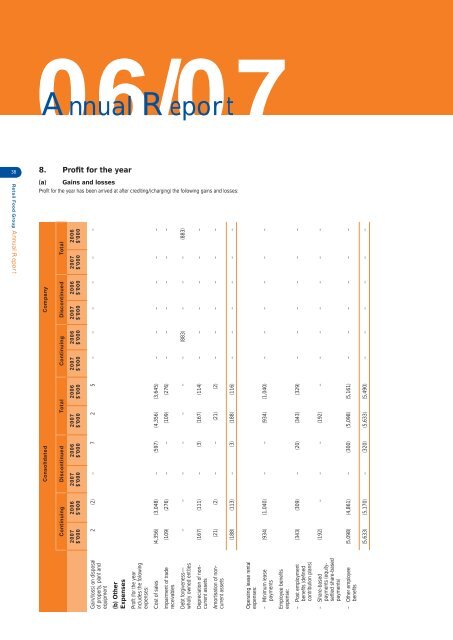
8. Profit for the year<br />
<strong>Retail</strong> <strong>Food</strong> <strong>Group</strong> <strong>Annual</strong> <strong>Report</strong><br />
(a)<br />
Consolidated Company<br />
Continuing Discontinued Total Continuing Discontinued Total<br />
Gains and losses<br />
Profi t for the year has been arrived at after crediting/(charging) the following gains and losses:<br />
2006<br />
$’000<br />
<strong>2007</strong><br />
$’000<br />
2006<br />
$’000<br />
<strong>2007</strong><br />
$’000<br />
2006<br />
$’000<br />
<strong>2007</strong><br />
$’000<br />
2006<br />
$’000<br />
<strong>2007</strong><br />
$’000<br />
2006<br />
$’000<br />
<strong>2007</strong><br />
$’000<br />
2006<br />
$’000<br />
<strong>2007</strong><br />
$’000<br />
2 (2) – 7 2 5 – – – – – –<br />
Gain/(loss) on disposal<br />
of property, plant and<br />
equipment<br />
(b) Other<br />
Expenses<br />
Profi t (for the year<br />
includes the following<br />
expenses:<br />
Cost of sales (4,356) (3,048) – (597) (4,356) (3,645) – – – – – –<br />
(109) (276) – – (109) (276) – – – – – –<br />
Impairment of trade<br />
receivables<br />
– – – – – – – (883) – – – (883)<br />
Debt forgiveness—<br />
wholly owned entities<br />
(167) (111) – (3) (167) (114) – – – – – –<br />
Depreciation of noncurrent<br />
assets<br />
(21) (2) – – (21) (2) – – – – – –<br />
Amortisation of noncurrent<br />
assets<br />
(188) (113) – (3) (188) (116) – – – – – –<br />
Operating lease rental<br />
expenses:<br />
(934) (1,040) – – (934) (1,040) – – – – – –<br />
– Minimum lease<br />
payments<br />
Employee benefi ts<br />
expense:<br />
(343) (309) – (20) (343) (329) – – – – – –<br />
– Post employment<br />
benefi ts (defi ned<br />
contribution plans)<br />
(192) – – – (192) – – – – – – –<br />
– Share-based<br />
payments (equitysettled<br />
share-based<br />
payments)<br />
(5,098) (4,861) – (300) (5,098) (5,161) – – – – – –<br />
– Other employee<br />
benefi ts<br />
(5,633) (5,170) – (320) (5,633) (5,490) – – – – – –