OneSteel Sustainability Report 2010 (PDF) - Arrium
OneSteel Sustainability Report 2010 (PDF) - Arrium
OneSteel Sustainability Report 2010 (PDF) - Arrium

Create successful ePaper yourself
Turn your PDF publications into a flip-book with our unique Google optimized e-Paper software.
24<br />
<strong>OneSteel</strong><br />
<strong>Sustainability</strong><br />
<strong>Report</strong> <strong>2010</strong><br />
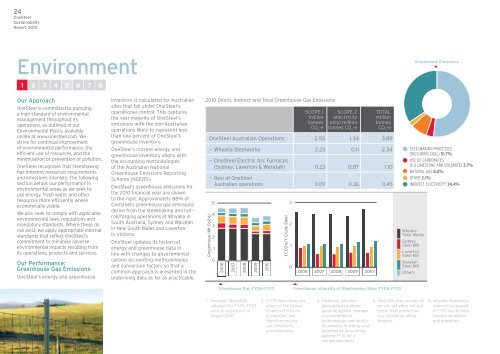
Environment<br />
1 2 3 4 5 6 7<br />
8<br />
Greenhouse Emissions<br />
Our Approach<br />
<strong>OneSteel</strong> is committed to pursuing<br />
a high standard of environmental<br />
management throughout its<br />
operations, as outlined in our<br />
Environmental Policy, available<br />
online at www.onesteel.com. We<br />
5<br />
strive for continual improvement<br />
of environmental performance, the<br />
4<br />
efficient use of resources, and the<br />
minimisation or prevention of pollution.<br />
3<br />
<strong>OneSteel</strong> recognises that steelmaking<br />
has inherent resources requirements<br />
2<br />
and emissions intensity. The following<br />
section details our performance in<br />
1<br />
environmental areas as we seek to<br />
use energy, fresh water and other<br />
0<br />
resources more efficiently where<br />
5<br />
economically viable.<br />
We also seek to comply with applicable<br />
4<br />
environmental laws, regulations and<br />
mandatory standards. Where these do<br />
3<br />
not exist, we apply appropriate internal<br />
standards that reflect <strong>OneSteel</strong>’s<br />
2<br />
commitment to minimise adverse<br />
environmental impacts resulting from<br />
1<br />
its operations, products and services.<br />
Our Performance:<br />
Greenhouse Gas Emissions<br />
<strong>OneSteel</strong>’s energy and greenhouse<br />
0<br />
inventory is calculated for Australian<br />
sites that fall under <strong>OneSteel</strong>’s<br />
operational control. This captures<br />
the vast majority of <strong>OneSteel</strong>’s<br />
emissions with the non-Australian<br />
operations likely to represent less<br />
than one percent of <strong>OneSteel</strong>’s<br />
greenhouse inventory.<br />
<strong>OneSteel</strong>’s current energy and<br />
greenhouse inventory aligns with<br />
the accounting methodologies<br />
of the Australian National<br />
Greenhouse Emissions <strong>Report</strong>ing<br />
Scheme (NGERS).<br />
<strong>OneSteel</strong>’s greenhouse emissions for<br />
the <strong>2010</strong> financial year are shown<br />
to the right. Approximately 88% of<br />
<strong>OneSteel</strong>’s greenhouse gas emissions<br />
derive from the steelmaking and hot–<br />
roll/forging operations at Whyalla in<br />
South Australia, Sydney and Waratah<br />
in New South Wales and Laverton<br />
in Victoria.<br />
<strong>OneSteel</strong> updates its historical<br />
energy and greenhouse data in<br />
line with changes to governmental<br />
carbon accounting methodologies<br />
and conversion factors so that a<br />
common approach is presented in the<br />
underlying data as far as practicable.<br />
<strong>2010</strong> Direct, Indirect and Total Greenhouse Gas Emissions<br />
Greenhouse (Mt Co2-e)<br />
Scope 1<br />
million<br />
tonnes<br />
CO 2<br />
-e<br />
Scope 2<br />
(electricity<br />
only) million<br />
tonnes CO 2<br />
-e<br />
Total<br />
million<br />
tonnes<br />
CO 2<br />
-e<br />
<strong>OneSteel</strong> Australian Operations 2.55 1.34 3.89<br />
— Whyalla Steelworks 2.23 0.11 2.34<br />
— <strong>OneSteel</strong> Electric Arc Furnaces<br />
(Sydney, Laverton & Waratah) 0.23 0.87 1.10<br />
— Rest of <strong>OneSteel</strong><br />
Australian operations 0.09 0.36 0.45<br />
5<br />
4<br />
3<br />
2<br />
1<br />
0<br />
2006<br />
2007<br />
2008<br />
2009<br />
<strong>2010</strong><br />
t CO2-e/ t Crude Steel<br />
3<br />
2<br />
1<br />
0<br />
2006 2007 2008 2009 <strong>2010</strong><br />
Steelmaking Processes<br />
• (including coal) 51.7%<br />
Use of Carbonates<br />
Natural Gas 8.0%<br />
Other 2.1%<br />
•<br />
(e.g limestone and dolomite) 3.7%<br />
Indirect Electricity 34.4%<br />
Whyalla<br />
Steel Works 1.5<br />
Sydney<br />
Steel Mill 1.0<br />
Laverton<br />
0.5<br />
Steel Mill<br />
Waratah<br />
0.0<br />
Steel Mill<br />
Others<br />
3.0<br />
2.5<br />
2.0<br />
Greenhouse Gas FY06-FY10<br />
Greenhouse Intensity of Steelmaking Sites FY06-FY10<br />
1. Smorgon Steel data<br />
obtained for FY06, FY07<br />
prior to acquisition in<br />
August 2007.<br />
2. FY09 data shows the<br />
effect of the Global<br />
Financial Crisis on<br />
production, and<br />
therefore energy<br />
use, emissions,<br />
and intensities.<br />
3. Historical data has<br />
been adjusted where<br />
possible against changes<br />
in governmental<br />
methodology and facility<br />
boundaries in energy and<br />
greenhouse accounting<br />
against FY10 for a<br />
comparable basis.<br />
4. Steel Mill sites include all<br />
on–site activities not just<br />
crude steel production<br />
(e.g. including rolling,<br />
forging).<br />
5. Whyalla Steelworks<br />
intensity increased<br />
in FY10 due to blast<br />
furnace problems<br />
and downtime.