

“A Stitch in Time...”

Create successful ePaper yourself
Turn your PDF publications into a flip-book with our unique Google optimized e-Paper software.
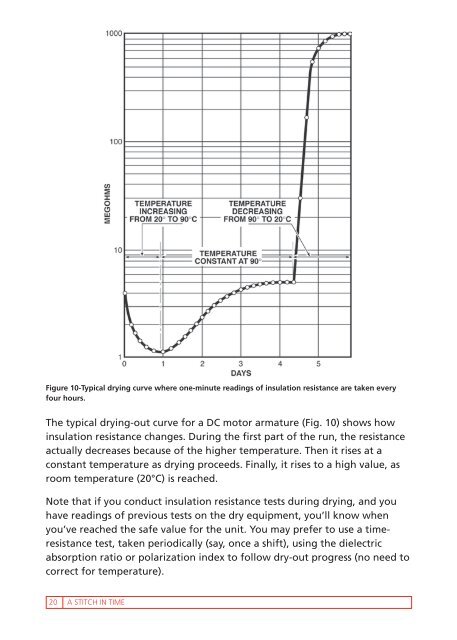
Figure 10-Typical dry<strong>in</strong>g curve where one-m<strong>in</strong>ute read<strong>in</strong>gs of <strong>in</strong>sulation resistance are taken every<br />
four hours.<br />
The typical dry<strong>in</strong>g-out curve for a DC motor armature (Fig. 10) shows how<br />
<strong>in</strong>sulation resistance changes. Dur<strong>in</strong>g the first part of the run, the resistance<br />
actually decreases because of the higher temperature. Then it rises at a<br />
constant temperature as dry<strong>in</strong>g proceeds. F<strong>in</strong>ally, it rises to a high value, as<br />
room temperature (20°C) is reached.<br />
Note that if you conduct <strong>in</strong>sulation resistance tests dur<strong>in</strong>g dry<strong>in</strong>g, and you<br />
have read<strong>in</strong>gs of previous tests on the dry equipment, you’ll know when<br />
you’ve reached the safe value for the unit. You may prefer to use a timeresistance<br />
test, taken periodically (say, once a shift), us<strong>in</strong>g the dielectric<br />
absorption ratio or polarization <strong>in</strong>dex to follow dry-out progress (no need to<br />
correct for temperature).<br />
20<br />
A STITCH IN TIME