When Healing Becomes Educating, Vol. 2 - Waldorf Research Institute
When Healing Becomes Educating, Vol. 2 - Waldorf Research Institute
When Healing Becomes Educating, Vol. 2 - Waldorf Research Institute

Create successful ePaper yourself
Turn your PDF publications into a flip-book with our unique Google optimized e-Paper software.
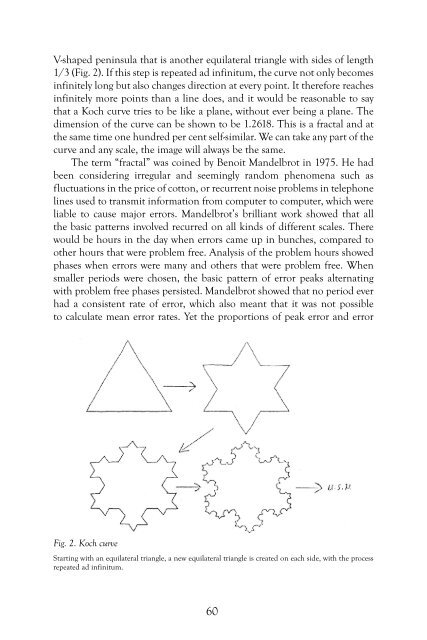
V-shaped peninsula that is another equilateral triangle with sides of length<br />
1/3 (Fig. 2). If this step is repeated ad infinitum, the curve not only becomes<br />
infinitely long but also changes direction at every point. It therefore reaches<br />
infinitely more points than a line does, and it would be reasonable to say<br />
that a Koch curve tries to be like a plane, without ever being a plane. The<br />
dimension of the curve can be shown to be 1.2618. This is a fractal and at<br />
the same time one hundred per cent self-similar. We can take any part of the<br />
curve and any scale, the image will always be the same.<br />
The term “fractal” was coined by Benoit Mandelbrot in 1975. He had<br />
been considering irregular and seemingly random phenomena such as<br />
fluctuations in the price of cotton, or recurrent noise problems in telephone<br />
lines used to transmit information from computer to computer, which were<br />
liable to cause major errors. Mandelbrot’s brilliant work showed that all<br />
the basic patterns involved recurred on all kinds of different scales. There<br />
would be hours in the day when errors came up in bunches, compared to<br />
other hours that were problem free. Analysis of the problem hours showed<br />
phases when errors were many and others that were problem free. <strong>When</strong><br />
smaller periods were chosen, the basic pattern of error peaks alternating<br />
with problem free phases persisted. Mandelbrot showed that no period ever<br />
had a consistent rate of error, which also meant that it was not possible<br />
to calculate mean error rates. Yet the proportions of peak error and error<br />
Fig. 2. Koch curve<br />
Starting with an equilateral triangle, a new equilateral triangle is created on each side, with the process<br />
repeated ad infinitum.<br />
60