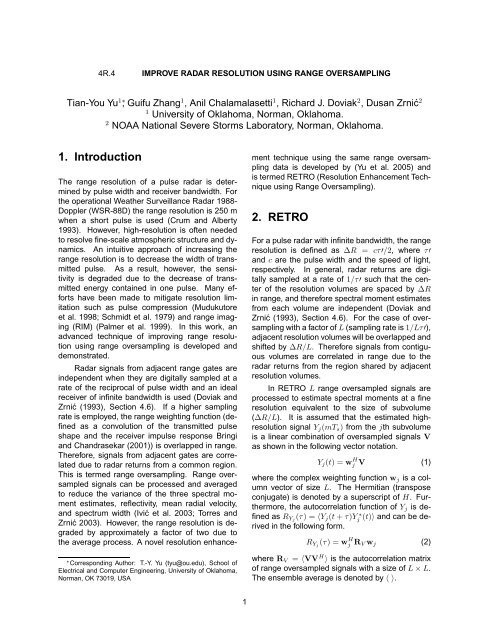
1. Introduction 2. RETRO - AMS supported meetings
1. Introduction 2. RETRO - AMS supported meetings
1. Introduction 2. RETRO - AMS supported meetings

Create successful ePaper yourself
Turn your PDF publications into a flip-book with our unique Google optimized e-Paper software.
4R.4 IMPROVE RADAR RESOLUTION USING RANGE OVERSAMPLING<br />
Tian-You Yu 1∗ , Guifu Zhang 1 , Anil Chalamalasetti 1 , Richard J. Doviak 2 , Dusan Zrnić 2<br />
1 University of Oklahoma, Norman, Oklahoma.<br />
2 NOAA National Severe Storms Laboratory, Norman, Oklahoma.<br />
<strong>1.</strong> <strong>Introduction</strong><br />
The range resolution of a pulse radar is determined<br />
by pulse width and receiver bandwidth. For<br />
the operational Weather Surveillance Radar 1988-<br />
Doppler (WSR-88D) the range resolution is 250 m<br />
when a short pulse is used (Crum and Alberty<br />
1993). However, high-resolution is often needed<br />
to resolve fine-scale atmospheric structure and dynamics.<br />
An intuitive approach of increasing the<br />
range resolution is to decrease the width of transmitted<br />
pulse. As a result, however, the sensitivity<br />
is degraded due to the decrease of transmitted<br />
energy contained in one pulse. Many efforts<br />
have been made to mitigate resolution limitation<br />
such as pulse compression (Mudukutore<br />
et al. 1998; Schmidt et al. 1979) and range imaging<br />
(RIM) (Palmer et al. 1999). In this work, an<br />
advanced technique of improving range resolution<br />
using range oversampling is developed and<br />
demonstrated.<br />
Radar signals from adjacent range gates are<br />
independent when they are digitally sampled at a<br />
rate of the reciprocal of pulse width and an ideal<br />
receiver of infinite bandwidth is used (Doviak and<br />
Zrnić (1993), Section 4.6). If a higher sampling<br />
rate is employed, the range weighting function (defined<br />
as a convolution of the transmitted pulse<br />
shape and the receiver impulse response Bringi<br />
and Chandrasekar (2001)) is overlapped in range.<br />
Therefore, signals from adjacent gates are correlated<br />
due to radar returns from a common region.<br />
This is termed range oversampling. Range oversampled<br />
signals can be processed and averaged<br />
to reduce the variance of the three spectral moment<br />
estimates, reflectivity, mean radial velocity,<br />
and spectrum width (Ivić et al. 2003; Torres and<br />
Zrnić 2003). However, the range resolution is degraded<br />
by approximately a factor of two due to<br />
the average process. A novel resolution enhance-<br />
∗ Corresponding Author: T.-Y. Yu (tyu@ou.edu), School of<br />
Electrical and Computer Engineering, University of Oklahoma,<br />
Norman, OK 73019, USA<br />
1<br />
ment technique using the same range oversampling<br />
data is developed by (Yu et al. 2005) and<br />
is termed <strong>RETRO</strong> (Resolution Enhancement Technique<br />
using Range Oversampling).<br />
<strong>2.</strong> <strong>RETRO</strong><br />
For a pulse radar with infinite bandwidth, the range<br />
resolution is defined as ∆R = cτ′/2, where τ′<br />
and c are the pulse width and the speed of light,<br />
respectively. In general, radar returns are digitally<br />
sampled at a rate of 1/τ′ such that the center<br />
of the resolution volumes are spaced by ∆R<br />
in range, and therefore spectral moment estimates<br />
from each volume are independent (Doviak and<br />
Zrnić (1993), Section 4.6). For the case of oversampling<br />
with a factor of L (sampling rate is 1/Lτ′),<br />
adjacent resolution volumes will be overlapped and<br />
shifted by ∆R/L. Therefore signals from contiguous<br />
volumes are correlated in range due to the<br />
radar returns from the region shared by adjacent<br />
resolution volumes.<br />
In <strong>RETRO</strong> L range oversampled signals are<br />
processed to estimate spectral moments at a fine<br />
resolution equivalent to the size of subvolume<br />
(∆R/L). It is assumed that the estimated highresolution<br />
signal Yj(mTs) from the jth subvolume<br />
is a linear combination of oversampled signals V<br />
as shown in the following vector notation.<br />
Yj(t) = w H j V (1)<br />
where the complex weighting function wj is a column<br />
vector of size L. The Hermitian (transpose<br />
conjugate) is denoted by a superscript of H. Fur-<br />
thermore, the autocorrelation function of Yj is de-<br />
(t)〉 and can be derived<br />
in the following form.<br />
fined as RYj (τ) = 〈Yj(t + τ)Y ∗<br />
j<br />
RYj (τ) = wH j RV wj<br />
(2)<br />
where RV = 〈VV H 〉 is the autocorrelation matrix<br />
of range oversampled signals with a size of L × L.<br />
The ensemble average is denoted by 〈 〉.
Now the key is to determine the complex<br />
weighting function wj. A relatively simple and<br />
robust method developed by Capon (1969) was<br />
successfully applied to atmospheric radar to improve<br />
angular resolution using signals from spatially<br />
spaced receivers (Palmer et al. 1998; Yu et al.<br />
2000), and to obtain high-resolution vertical profile<br />
of reflectivity and three-dimensional wind field<br />
using shifted frequencies (Palmer et al. 1999; Yu<br />
and Brown 2004). Using Capon’s approach, the<br />
weighting vector in <strong>RETRO</strong> can be obtained by<br />
solving the following constrained optimization.<br />
min RYj<br />
wj<br />
(0), subject to qHj wj = 1 (3)<br />
where qj is a column vector of size L specifying<br />
the weights for the true high resolution signals at<br />
the jth subvolume to produce oversampled signals<br />
in V. The optimization ensures that the effect of<br />
interference is minimized while the response of the<br />
weighting function at the jth subvolume is unity. Interference<br />
refers to signals from subvolumes other<br />
than the subvolume in which the <strong>RETRO</strong> estimation<br />
is performed. The Capon weighting vector can<br />
be derived using a Lagrange method (Capon 1969;<br />
Palmer et al. 1998; Yu et al. 2005). As a result, time<br />
series of high-resolution signals at a subvolume<br />
Yj can be generated by substituting the weighting<br />
function into (1). Reflectivity and radial velocity<br />
at subvolumes can be estimated by processing<br />
Yj(mTs), m = 0, 1, . . . M − 1,using either spectral<br />
technique or autocovariance methods (Doviak and<br />
Zrnić (1993), Chapter 6), where Ts is the pulse repetition<br />
time and M is the number of samples.<br />
Yu et al. (2005) have shown that the estimated<br />
high-resolution signal power ( ˆ Pj) is a weighted<br />
sum of the true high-resolution power σ2 l at 2L − 1<br />
subvolumes.<br />
ˆPj =<br />
2L−1 �<br />
l=1<br />
Ejlσ 2 l<br />
(4)<br />
where the weight Ejl is the lth element of square<br />
of the <strong>RETRO</strong> response of the weighting function<br />
Ej, and j = 1, . . . 2L − <strong>1.</strong> Thus, performance<br />
of high-resolution power estimate is determined by<br />
the weighting function which is adaptive to the atmospheric<br />
structure. Note that a deterministic bias<br />
in <strong>RETRO</strong> power estimate will be obtained for the<br />
case of uniform reflectivity. For example, the theoretical<br />
bias for L = 10 is approximately 7.4 dB<br />
given that the correlation of oversampled signals<br />
in range has a triangular shape (Torres and Zrnić<br />
2003). Nevertheless, for the case of uniform reflectivity<br />
resolution is not of primary interest and<br />
the whitening-based technique may be used to improve<br />
the statistical accuracy of the estimates. Yu<br />
2<br />
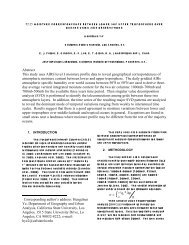
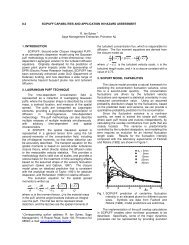
(a) Signal power and velocity from conventional<br />
sampling<br />
y−direction (km)<br />
5.4<br />
5.2<br />
5<br />
4.8<br />
4.6<br />
−0.5 0<br />
x−direction (km)<br />
0.5<br />
S (dB)<br />
0 20 40 60<br />
y−direction (km)<br />
5.4<br />
5.2<br />
5<br />
4.8<br />
4.6<br />
−0.5 0<br />
x−direction (km)<br />
0.5<br />
V (ms −1 )<br />
−20 0 20<br />
(b) Signal power and velocity from <strong>RETRO</strong><br />
y−direction (km)<br />
5.4<br />
5.2<br />
5<br />
4.8<br />
4.6<br />
−0.5 0<br />
x−direction (km)<br />
0.5<br />
Z (dB)<br />
0 20 40 60<br />
y−direction (km)<br />
5.4<br />
5.2<br />
5<br />
4.8<br />
4.6<br />
−0.5 0<br />
x−direction (km)<br />
0.5<br />
V (ms −1 )<br />
−40 −20 0 20 40<br />
Figure 1: Reflectivity and velocity fields of a tornado<br />
vortex observed by a virtual WSR-88D using<br />
(a) conventional sampling (L = 1) and (b) <strong>RETRO</strong><br />
(L = 5).<br />
et al. (2005) have further shown that the highresolution<br />
<strong>RETRO</strong> velocity is a biased estimator<br />
except for the case of uniform velocity field. However,<br />
the bias can be significantly small such that<br />
the <strong>RETRO</strong> high-resolution velocity estimates still<br />
reflects the true velocity field.<br />
3. Results<br />
<strong>RETRO</strong> is tested and verified using numerical simulation<br />
of a tornado vortex. Oversampled data<br />
were generated based on a simulation scheme<br />
similar to the one used in Torres and Zrnić (2003).<br />
Ideal time series were generated independently at<br />
each subvolume according to designed Doppler
spectrum as described in Zrnić (1975). In this<br />
work, tornado spectra are simulated using a combined<br />
Rankine model (Zrnić and Doviak 1975; Yu<br />
et al. 2003). Subsequently, range oversampled signals<br />
were obtained through a weighted sum of the<br />
L ideal time series. The weights are determined by<br />
the range weighting function. In this work, a rectangular<br />
pulse of 250 m is simulated to demonstrate<br />
the resolution improvement on WSR-88D. Moreover,<br />
it is assumed that receiver has a bandwidth<br />
much larger than 1/τ′, the same condition used in<br />
Torres and Zrnić (2003) and Ivić et al. (2003). A sequence<br />
of white Gaussian noise is added to each<br />
set of oversampled data according to a designed<br />
signal-to-noise ratio (SNR).<br />
In simulation, a tornado is located at 5 km<br />
north of the radar in which the diameter of the maximum<br />
wind is 100 m and the maximum tangential<br />
wind is 50 m s −1 . A doughnut-shape reflectivity<br />
with a width of 40 m is simulated and the maximum<br />
reflectivity is located at the radius of 110 m from<br />
the center of the tornado. Level I time series data<br />
collected by a virtual WSR-88D with 1 ◦ beamwidth<br />
and 250 m pulse length scanning through the tornado<br />
were simulated with and without range oversampling.<br />
The later sampling scheme is termed<br />
conventional sampling (CS) (i.e., L = 1). Both signals<br />
were generated at a constant SNR of 40 dB.<br />
The signal power and mean radial velocity from CS<br />
and <strong>RETRO</strong> with L = 5 are shown in Figure 1(a)<br />
and (b), respectively. It is clear that the reflectivity<br />
structure and velocity distribution in range are better<br />
resolved when <strong>RETRO</strong> is used. Furthermore,<br />
the range profile of signal power and radial velocity<br />
at the azimuth angle of 1 ◦ , as indicated by the<br />
white lines in Figure 1(b), is shown in Figure 2 for<br />
both CS and <strong>RETRO</strong>. The modeled signal power<br />
and radial velocity with 50 m range resolution are<br />
denoted by red lines. It is evident that <strong>RETRO</strong><br />
can reconstruct the tornado reflectivity and velocity<br />
profile at 50 m resolution using a 250 m pulse and<br />
oversampling factor of 5. Furthermore, the performance<br />
of <strong>RETRO</strong> as a function of SNR, oversampling<br />
factor (L), and the number of samples is investigated<br />
by Yu et al. (2005).<br />
Doppler spectra reconstructed using <strong>RETRO</strong><br />
at the subvolume of 4.8, 5.05, and 5.25 km are<br />
shown in Figure 3. The <strong>RETRO</strong>-produced and<br />
model spectra are denoted by black and red lines,<br />
respectively. It has been shown that tornado spectrum<br />
is typically broad closed to the center of tornado<br />
vortex and can be used to improve the detection<br />
(Yu et al. 2003, 2004). It is clear that not only<br />
the three spectral moments but the Doppler spectra<br />
at these subvolumes can be reconstructed us-<br />
3<br />
ing <strong>RETRO</strong>. Another application of <strong>RETRO</strong> is the<br />
mitigation of clutter contamination and is demonstrated<br />
in Yu et al. (2005).<br />
4. Conclusions<br />
In this work, the application of range oversampled<br />
signals is further exploited.A technique was developed<br />
to improve range resolution using range oversampling<br />
and is termed <strong>RETRO</strong>. Improving resolution<br />
using overlapped range weighting function<br />
can be postulated as an inversion problem and the<br />
Capon method was used to solve the problem because<br />
of its simplicity and robustness. In <strong>RETRO</strong> it<br />
is assumed that high-resolution signals is a linear<br />
combination of oversampled signals. The weighting<br />
function is obtained by solving a constrained<br />
optimization. As a result, <strong>RETRO</strong> power and velocity<br />
estimates are adaptive to the oversampled data<br />
and optimal estimates can be obtained. <strong>RETRO</strong><br />
is demonstrated using numerical simulations for<br />
a tornado case. The variation of tornado reflectivity<br />
and velocity in range was observed at resolution<br />
of subvolume using Capon <strong>RETRO</strong>, while<br />
the conventional processing techniques cannot resolve<br />
them. The result suggests that fine resolution<br />
can be achieved by transmitting a longer pulse and<br />
oversampling returns in range. However, note that<br />
the performance of <strong>RETRO</strong> is limited when the reflectivity<br />
is uniform or slowing varying in range.<br />
References<br />
Bringi, V. N. and V. Chandrasekar, 2001: Polarimetric<br />
Doppler Weather Radar Principles and<br />
Applications. Cambridge University Press, Cambridge,<br />
UK.<br />
Capon, J., 1969: High-resolution frequencywavenumber<br />
spectrum analysis. Proc. IEEE, 57,<br />
1408–1419.<br />
Crum, T. D. and R. L. Alberty, 1993: The wsr-88d<br />
and the wsr-88d operational support facility. Bull.<br />
Amer. Meteor. Soc., 74, 1669–1687.<br />
Doviak, R. J. and D. S. Zrnić, 1993: Doppler<br />
Radar and Weather Observations. Academic,<br />
San Diego, Calif.<br />
Ivić, I. R., D. Zrnić, and S. M. Torres, 2003: Whitening<br />
in range to improve weather radar spectral<br />
moment estimates part ii: experimental evaluation.<br />
J. Atmos. Oceanic Technol., 20, 1449–<br />
1459.
Power (dB)<br />
Velocity (ms −1 )<br />
80 (a)<br />
60<br />
40<br />
20<br />
0<br />
−20<br />
4.5 5<br />
Range (km)<br />
5.5<br />
(b)<br />
40<br />
30<br />
20<br />
10<br />
0<br />
Model (50m)<br />
CS (250m)<br />
<strong>RETRO</strong><br />
4.5 5<br />
Range (km)<br />
5.5<br />
Figure 2: The range profile of (a) signal power and (b) radial velocity at 1 ◦ azimuth in Figure 1(b). It is<br />
evident the model reflectivity and velocity can be reconstructed using <strong>RETRO</strong>.<br />
Mudukutore, A. S., V. Chandrasekar, and R. J.<br />
Keeler, 1998: Pulse compression for weather<br />
radars. IEEE Trans. Geosci. Remote Sens., 36,<br />
125–14<strong>2.</strong><br />
Palmer, R. D., S. Gopalam, T.-Y. Yu, and S. Fukao,<br />
1998: Coherent radar imaging using capon’s<br />
method. Radio Sci., 33, 1585–1598.<br />
Palmer, R. D., T.-Y. Yu, and P. B. Chilson, 1999:<br />
Range imaging using frequency diversity. Radio<br />
Sci., 34, 1485–1496.<br />
Schmidt, G., R. Rüster, and P. Czechowsky, 1979:<br />
Complementary code and digital filtering for detection<br />
of weak vhf radar signals from the mesosphere.<br />
IEEE Trans. Geosci. Electro., 17, 154–<br />
16<strong>1.</strong><br />
Torres, S. M. and D. Zrnić, 2003: Whitening in<br />
range to improve weather radar spectral moment<br />
estimates. part i: formulation and simulation. J.<br />
Atmos. Oceanic Technol., 20, 1433–1448.<br />
4<br />
Yu, T.-Y. and W. O. J. Brown, 2004: High-resolution<br />
atmospheric profiling using combined spaced<br />
antenna and range imaging techniques. Radio<br />
Sci., 39, RS1101, doi:10.1029/2003RS002907.<br />
Yu, T.-Y., R. D. Palmer, and D. L. Hysell, 2000: A<br />
simulation study of coherent radar imaging. Radio<br />
Sci., 35, 1129–114<strong>1.</strong><br />
Yu, T.-Y., A. Shapiro, D. Zrnić, M. Foster, D. Andra,<br />
R. Doviak, and M. Yeary, 2004: Tornado spectral<br />
signature observed by wsr-88d. 22 nd Conference<br />
on Severe Local Storms.<br />
Yu, T.-Y., G. Zhang, A. Chalamalasetti, R. J.<br />
Doviak, and D. Zrnić, 2005: Resolution enhancement<br />
technique using range oversampling.<br />
J. Atmos. Oceanic Technol., in press.<br />
Yu, T.-Y., D. Zrnić, A. Shapiro, and M. B. Yeary,<br />
2003: Feasibility of earlier tornado detection using<br />
doppler spectra. 31st Conference on Radar<br />
Meteorology, 333–336.
Spectrum (dB)<br />
50<br />
0<br />
(a) 4.8 km<br />
50<br />
0<br />
(b) 5.05 km<br />
−50<br />
−50 0 50<br />
V (ms<br />
r −1 −50<br />
−50 0 50<br />
)<br />
V (ms<br />
r −1 −50<br />
−50 0 50<br />
)<br />
V (ms<br />
r −1 )<br />
50<br />
0<br />
(c) 5.25 km<br />
Model<br />
<strong>RETRO</strong><br />
Figure 3: An example of selected <strong>RETRO</strong> spectra at range of 4.8, 5.05, and 5.25 km.<br />
Zrnić, D. S., 1975: Simulation of weatherlike<br />
doppler spectra and signals. J. Appl. Meteorol.,<br />
14, 619–620.<br />
Zrnić, D. S. and R. J. Doviak, 1975: Velocity spectra<br />
of vortices scanned with a pulsed-doppler<br />
radar. J. Appl. Meteorol., 14, 1531–1539.<br />
5