


Create successful ePaper yourself
Turn your PDF publications into a flip-book with our unique Google optimized e-Paper software.
January 2012<br />
KMEFIC Research<br />
Equity Analysis Report<br />
Customers’ Power: A lot of the <strong>Saudi</strong> cement companies have shut down some of their production<br />
lines due to the export ban placed on cement. This reduction in supply is being coupled with an<br />
increase in demand due to the huge ongoing infrastructural projects. While the possibility of excess<br />
demand weakens customers’ power, the standardized nature of the product (cement) raises their<br />
power due to very low switching costs. Thus, customers’ power in the <strong>Saudi</strong> cement industry is<br />
moderate.<br />
Threat of Substitutes: <strong>Cement</strong> is a necessary input in most types of construction, and there is no<br />
real substitute for it in such projects. Thus, the threat of substitutes is very low.<br />
Business Rivalry: The large number of competing firms (13 to be exact) in the <strong>Saudi</strong> cement<br />
industry as well as the standardized nature of the product (cement) intensifies competition.<br />
However, an increase in total cement production is being met with an increase in sales volume due<br />
to growing demand. This makes price wars among the cement companies unlikely. Additionally,<br />
firms do not have to compete fiercely for market share due to the nature of the growing industry.<br />
Firms are able to improve revenues simply because of the expanding market. Furthermore, the<br />
companies are geographical dispersed due to the Kingdom’s size. Thus the business rivalry in the<br />
<strong>Saudi</strong> cement industry is moderate.<br />
Financial Performance<br />
Domestic Sales vs. Exports<br />
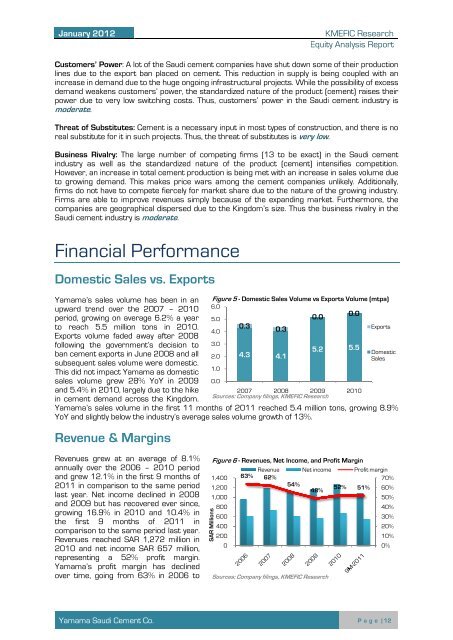
Yamama’s sales volume has been in an Figure 5 - Domestic Sales Volume vs Exports Volume (mtpa)<br />
upward trend over the 2007 – 2010<br />
6.0<br />
period, growing on average 0.0<br />
0.0<br />
6.2% a year 5.0<br />
to reach 5.5 million tons in 2010.<br />
0.3<br />
0.3<br />
Exports<br />
4.0<br />
Exports volume faded away after 2008<br />
following the government’s decision to 3.0<br />
5.2 5.5<br />
ban cement exports in June 2008 and all<br />
Domestic<br />
2.0 4.3 4.1<br />
Sales<br />
subsequent sales volume were domestic.<br />
1.0<br />
This did not impact Yamama as domestic<br />
sales volume grew 28% YoY in 2009<br />
and 5.4% in 2010, largely due to the hike<br />
in cement demand across the Kingdom.<br />
0.0<br />
2007 2008 2009<br />
Sources: <strong>Company</strong> filings, KMEFIC Research<br />
2010<br />
Yamama’s sales volume in the first 11 months of 2011 reached 5.4 million tons, growing 8.9%<br />
YoY and slightly below the industry’s average sales volume growth of 13%.<br />
Revenue & Margins<br />
Revenues grew at an average of 8.1%<br />
annually over the 2006 – 2010 period<br />
and grew 12.1% in the first 9 months of<br />
2011 in comparison to the same period<br />
last year. Net income declined in 2008<br />
and 2009 but has recovered ever since,<br />
growing 16.9% in 2010 and 10.4% in<br />
the first 9 months of 2011 in<br />
comparison to the same period last year.<br />
Revenues reached SAR 1,272 million in<br />
2010 and net income SAR 657 million,<br />
representing a 52% profit margin.<br />
Yamama’s profit margin has declined<br />
over time, going from 63% in 2006 to<br />
Figure 6 - Revenues, Net Income, and Profit Margin<br />
Revenue Net income<br />
Profit margin<br />
1,400 63% 62%<br />
70%<br />
1,200<br />
54%<br />
48%<br />
52% 51% 60%<br />
1,000<br />
50%<br />
SAR Millions<br />
800<br />
600<br />
400<br />
200<br />
0<br />
Sources: <strong>Company</strong> filings, KMEFIC Research<br />
40%<br />
30%<br />
20%<br />
10%<br />
0%<br />
Yamama <strong>Saudi</strong> <strong>Cement</strong> Co.<br />
P a g e | 12


