


Create successful ePaper yourself
Turn your PDF publications into a flip-book with our unique Google optimized e-Paper software.
January 2012<br />
KMEFIC Research<br />
Equity Analysis Report<br />
Table 1 - Key Performance Indicators<br />
in mil. SAR unless otherwise<br />
indicated<br />
FY-09 A FY-10 A FY-11 F FY-12 F FY-13 F FY-14 F FY-15 F<br />
Revenues 1,163 1,272 1,422 1,464 1,570 1,635 1,668<br />
Gross Profit 616 712 806 826 888 921 900<br />
Operating Profit 574 666 754 772 830 861 839<br />
Net Profit 562 657 739 758 817 847 824<br />
Operating Profit Margin 49.3% 52.4% 53.0% 52.7% 52.9% 52.7% 50.3%<br />
Net Profit Margin 48.3% 51.6% 51.9% 51.8% 52.0% 51.8% 49.4%<br />
EPS (SAR) 2.77* 3.25* 3.65* 3.74 4.03 4.18 4.07<br />
P/E 11.4 10.6 12.8 15.2 14.1 13.6 13.9<br />
P/B 2.1 2.2 2.8 3.0 2.9 2.8 2.7<br />
ROAE 19.1% 21.1% 22.7% 21.2% 21.0% 20.9% 19.6%<br />
Dividend yield 4.3% 5.7% 2.9% 5.4% 5.9% 6.1% 5.9%<br />
*Adjusted for the 50% capital increase<br />
Sources: <strong>Company</strong> filings, KMEFIC Research<br />
Yamama, The Stock in Tadawul<br />
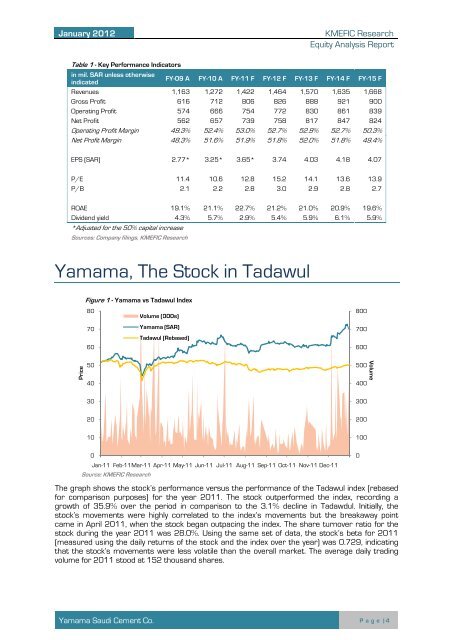
Figure 1 - Yamama vs Tadawul Index<br />
80<br />
70<br />
60<br />
Volume (000s)<br />
Yamama (SAR)<br />
Tadawul (Rebased)<br />
800<br />
700<br />
600<br />
Price<br />
50<br />
40<br />
500<br />
400<br />
Volume<br />
30<br />
300<br />
20<br />
200<br />
10<br />
100<br />
0<br />
Jan-11 Feb-11Mar-11 Apr-11 May-11 Jun-11 Jul-11 Aug-11 Sep-11 Oct-11 Nov-11 Dec-11<br />
Source: KMEFIC Research<br />
0<br />
The graph shows the stock’s performance versus the performance of the Tadawul index (rebased<br />
for comparison purposes) for the year 2011. The stock outperformed the index, recording a<br />
growth of 35.9% over the period in comparison to the 3.1% decline in Tadawdul. Initially, the<br />
stock’s movements were highly correlated to the index’s movements but the breakaway point<br />
came in April 2011, when the stock began outpacing the index. The share turnover ratio for the<br />
stock during the year 2011 was 28.0%. Using the same set of data, the stock’s beta for 2011<br />
(measured using the daily returns of the stock and the index over the year) was 0.729, indicating<br />
that the stock’s movements were less volatile than the overall market. The average daily trading<br />
volume for 2011 stood at 152 thousand shares.<br />
Yamama <strong>Saudi</strong> <strong>Cement</strong> Co. P a g e | 4


