

Annual Report 2008 - Skanska
Annual Report 2008 - Skanska
Annual Report 2008 - Skanska

You also want an ePaper? Increase the reach of your titles
YUMPU automatically turns print PDFs into web optimized ePapers that Google loves.
Business streams<br />
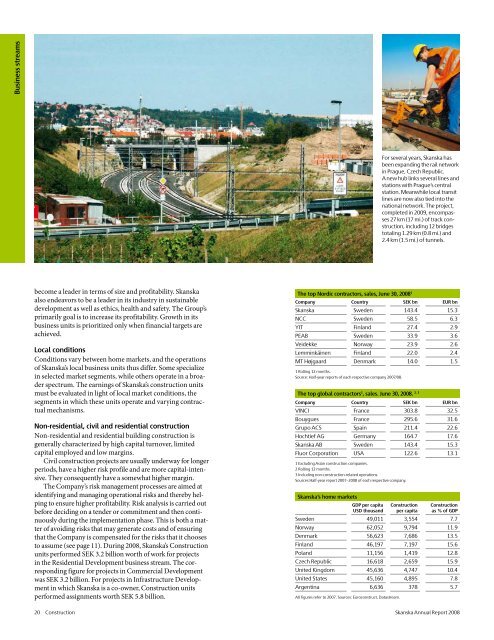
For several years, <strong>Skanska</strong> has<br />
been expanding the rail network<br />
in Prague, Czech Republic.<br />
A new hub links several lines and<br />
stations with Prague’s central<br />
station. Meanwhile local transit<br />
lines are now also tied into the<br />
national network. The project,<br />
completed in 2009, encompasses<br />
27 km (17 mi.) of track construction,<br />
including 12 bridges<br />
totaling 1.29 km (0.8 mi.) and<br />
2.4 km (1.5 mi.) of tunnels.<br />
become a leader in terms of size and profitability. <strong>Skanska</strong><br />
also endeavors to be a leader in its industry in sustainable<br />
development as well as ethics, health and safety. The Group’s<br />
primarily goal is to increase its profitability. Growth in its<br />
business units is prioritized only when financial targets are<br />
achieved.<br />
Local conditions<br />
Conditions vary between home markets, and the operations<br />
of <strong>Skanska</strong>’s local business units thus differ. Some specialize<br />
in selected market segments, while others operate in a broader<br />
spectrum. The earnings of <strong>Skanska</strong>’s construction units<br />
must be evaluated in light of local market conditions, the<br />
segments in which these units operate and varying contractual<br />
mechanisms.<br />
Non-residential, civil and residential construction<br />
Non-residential and residential building construction is<br />
generally characterized by high capital turnover, limited<br />
capital employed and low margins.<br />
Civil construction projects are usually underway for longer<br />
periods, have a higher risk profile and are more capital-intensive.<br />
They consequently have a somewhat higher margin.<br />
The Company’s risk management processes are aimed at<br />
identifying and managing operational risks and thereby helping<br />
to ensure higher profitability. Risk analysis is carried out<br />
before deciding on a tender or commitment and then continuously<br />
during the implementation phase. This is both a matter<br />
of avoiding risks that may generate costs and of ensuring<br />
that the Company is compensated for the risks that it chooses<br />
to assume (see page 11). During <strong>2008</strong>, <strong>Skanska</strong>’s Construction<br />
units performed SEK 3.2 billion worth of work for projects<br />
in the Residential Development business stream. The corresponding<br />
figure for projects in Commercial Development<br />
was SEK 3.2 billion. For projects in Infrastructure Development<br />
in which <strong>Skanska</strong> is a co-owner, Construction units<br />
performed assignments worth SEK 5.8 billion.<br />
The top Nordic contractors, sales, June 30, <strong>2008</strong> 1<br />
Company Country SEK bn EUR bn<br />
<strong>Skanska</strong> Sweden 143.4 15.3<br />
NCC Sweden 58.5 6.3<br />
YIT Finland 27.4 2.9<br />
PEAB Sweden 33.9 3.6<br />
Veidekke Norway 23.9 2.6<br />
Lemminkäinen Finland 22.0 2.4<br />
MT Højgaard Denmark 14.0 1.5<br />
1 Rolling 12 months.<br />
Source: Half-year reports of each respective company 2007/08.<br />
The top global contractors 1 , sales. June 30, <strong>2008</strong>. 2. 3<br />
Company Country SEK bn EUR bn<br />
VINCI France 303.8 32.5<br />
Bouygues France 295.6 31.6<br />
Grupo ACS Spain 211.4 22.6<br />
Hochtief AG Germany 164.7 17.6<br />
<strong>Skanska</strong> AB Sweden 143.4 15.3<br />
Fluor Corporation USA 122.6 13.1<br />
1 Excluding Asian construction companies.<br />
2 Rolling 12 months.<br />
3 Including non-construction-related operations.<br />
Sources:Half-year report 2007–<strong>2008</strong> of each respective company.<br />
<strong>Skanska</strong>’s home markets<br />
GDP per capita<br />
USD thousand<br />
Construction<br />
per capita<br />
Construction<br />
as % of GDP<br />
Sweden 49,011 3,554 7.7<br />
Norway 62,052 9,794 11.9<br />
Denmark 56,623 7,686 13.5<br />
Finland 46,197 7,197 15.6<br />
Poland 11,156 1,419 12.8<br />
Czech Republic 16,618 2,659 15.9<br />
United Kingdom 45,636 4,747 10.4<br />
United States 45,160 4,895 7.8<br />
Argentina 6,636 378 5.7<br />
All figures refer to 2007. Sources: Euroconstruct, Datastream.<br />
20 Construction <strong>Skanska</strong> <strong>Annual</strong> <strong>Report</strong> <strong>2008</strong>


