

Annual Report 2008 - Skanska
Annual Report 2008 - Skanska
Annual Report 2008 - Skanska

Create successful ePaper yourself
Turn your PDF publications into a flip-book with our unique Google optimized e-Paper software.
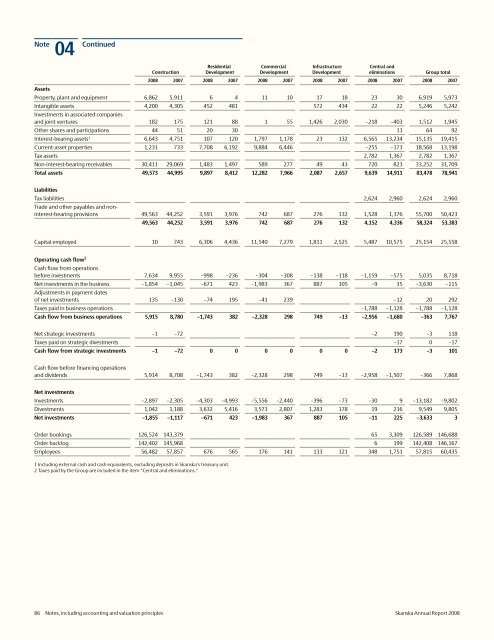
Note<br />
04 Continued Construction<br />
Residential<br />
Development<br />
Commercial<br />
Development<br />
Infrastructure<br />
Development<br />
Central and<br />
eliminations Group total<br />
<strong>2008</strong> 2007 <strong>2008</strong> 2007 <strong>2008</strong> 2007 <strong>2008</strong> 2007 <strong>2008</strong> 2007 <strong>2008</strong> 2007<br />
Assets<br />
Property, plant and equipment 6,862 5,911 6 4 11 10 17 18 23 30 6,919 5,973<br />
Intangible assets 4,200 4,305 452 481 572 434 22 22 5,246 5,242<br />
Investments in associated companies<br />
and joint ventures 182 175 121 88 1 55 1,426 2,030 –218 –403 1,512 1,945<br />
Other shares and participations 44 51 20 30 11 64 92<br />
Interest-bearing assets 1 6,643 4,751 107 120 1,797 1,178 23 132 6,565 13,234 15,135 19,415<br />
Current-asset properties 1,231 733 7,708 6,192 9,884 6,446 –255 –173 18,568 13,198<br />
Tax assets 2,782 1,367 2,782 1,367<br />
Non-interest-bearing receivables 30,411 29,069 1,483 1,497 589 277 49 43 720 823 33,252 31,709<br />
Total assets 49,573 44,995 9,897 8,412 12,282 7,966 2,087 2,657 9,639 14,911 83,478 78,941<br />
Liabilities<br />
Tax liabilities 2,624 2,960 2,624 2,960<br />
Trade and other payables and noninterest-bearing<br />
provisions 49,563 44,252 3,591 3,976 742 687 276 132 1,528 1,376 55,700 50,423<br />
49,563 44,252 3,591 3,976 742 687 276 132 4,152 4,336 58,324 53,383<br />
Capital employed 10 743 6,306 4,436 11,540 7,279 1,811 2,525 5,487 10,575 25,154 25,558<br />
Operating cash flow 2<br />
Cash flow from operations<br />
before investments 7,634 9,955 –998 –236 –304 –308 –138 –118 –1,159 –575 5,035 8,718<br />
Net investments in the business –1,854 –1,045 –671 423 –1,983 367 887 105 –9 35 –3,630 –115<br />
Adjustments in payment dates<br />
of net investments 135 –130 –74 195 –41 239 –12 20 292<br />
Taxes paid in business operations –1,788 –1,128 –1,788 –1,128<br />
Cash flow from business operations 5,915 8,780 –1,743 382 –2,328 298 749 –13 –2,956 –1,680 –363 7,767<br />
Net strategic investments –1 –72 –2 190 –3 118<br />
Taxes paid on strategic divestments –17 0 –17<br />
Cash flow from strategic investments –1 –72 0 0 0 0 0 0 –2 173 –3 101<br />
Cash flow before financing operations<br />
and dividends 5,914 8,708 –1,743 382 –2,328 298 749 –13 –2,958 –1,507 –366 7,868<br />
Net investments<br />
Investments –2,897 –2,305 –4,303 –4,993 –5,556 –2,440 –396 –73 –30 9 –13,182 –9,802<br />
Divestments 1,042 1,188 3,632 5,416 3,573 2,807 1,283 178 19 216 9,549 9,805<br />
Net investments –1,855 –1,117 –671 423 –1,983 367 887 105 –11 225 –3,633 3<br />
Order bookings 126,524 143,379 65 3,309 126,589 146,688<br />
Order backlog 142,402 145,968 6 199 142,408 146,167<br />
Employees 56,482 57,857 676 565 176 141 133 121 348 1,751 57,815 60,435<br />
1 Including external cash and cash equivalents, excluding deposits in <strong>Skanska</strong>’s treasury unit.<br />
2 Taxes paid by the Group are included in the item “Central and eliminations.”<br />
86 Notes, including accounting and valuation principles <strong>Skanska</strong> <strong>Annual</strong> <strong>Report</strong> <strong>2008</strong>


