- Page 1 and 2:
A N N U A L R E P O R T 2 0 1 0
- Page 4 and 5:
PAGE PAGE PAGE financial summary 14
- Page 6 and 7:
Grupo Security Summarized Unconsoli
- Page 9:
02 principal financial indicators n
- Page 12 and 13:
DEAR SHAREHOLDERS I have the pleasu
- Page 15 and 16:
oard and management 04
- Page 17 and 18:
04board and management SENIOR MANAG
- Page 19 and 20:
05 recognitions 17 COMPANIES WITH B
- Page 21 and 22:
06 activities 19 ENCUENTRO JUVENTUD
- Page 23 and 24:
06 activities 21 A SCHOOL FOR VILLA
- Page 25:
2003 Inversiones Seguros Security i
- Page 28 and 29:
ECONOMIC CONTEXT EXTERNAL ENVIRONME
- Page 30 and 31:
CHILE: GDP GROWTH (%) 7 6 5 4 3 2 1
- Page 33 and 34:
09strategic pillars
- Page 35 and 36: 09strategic pillars security, where
- Page 37 and 38: 09 strategic pillars RISK MANAGEMEN
- Page 39 and 40: 10business areas
- Page 41: 10 business areas 39 PAGE
- Page 44 and 45: FINANCING BANKING INDUSTRY Banking
- Page 46 and 47: The following graph shows the evolu
- Page 48 and 49: EARNINGS AND ROE OF BANCO SECURITY
- Page 50 and 51: RISK Banco Security has been charac
- Page 53 and 54: 10business areas I N V E S T M E N
- Page 55 and 56: 10 business areas 53 Administradora
- Page 57: 10 business areas 55 SECURITIZADORA
- Page 60 and 61: INSURANCE INSURANCE INDUSTRY The Ch
- Page 62 and 63: Compañía de Seguros Generales Pen
- Page 65 and 66: 10business areas S E R V I C E S
- Page 67: It is important to recall that the
- Page 70 and 71: INVESTMENT POLICY The bylaws of Gru
- Page 72 and 73: The individual financial liabilitie
- Page 74 and 75: BANK CREDITORS As of December 31, 2
- Page 76 and 77: ASSOCIATED RISKS Local Financial Ri
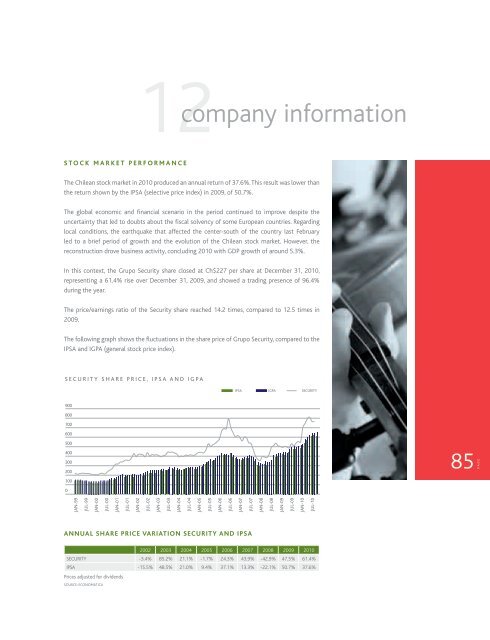
- Page 79 and 80: company information 12
- Page 81 and 82: 12company information In accordance
- Page 83 and 84: 12 company information 81 • Revis
- Page 85: 12 company information 83 In Seguro
- Page 89 and 90: 12 company information 87 SOCIEDAD
- Page 91 and 92: 12 company information 89 INMOBILIA
- Page 93 and 94: Regulatory Framework Grupo Security
- Page 95 and 96: financial statements 13
- Page 97: financial statements 13 C o n s o l
- Page 100 and 101: Consolidated Statement of Financial
- Page 102 and 103: Consolidated statement of comprehen
- Page 104 and 105: CONSOLIDATED STATEMENTS OF CASH FLO
- Page 106 and 107: CONSOLIDATED STATEMENT OF CHANGES I
- Page 108 and 109: The following companies are include
- Page 110 and 111: ) Description of Grupo Security’s
- Page 112 and 113: - Fair value option As indicated in
- Page 114 and 115: Disclosure of the Adoption of new a
- Page 116 and 117: For financial assets, the amortized
- Page 118 and 119: The recoverable amount is the highe
- Page 120 and 121: Vida Security maintains current der
- Page 122 and 123: f) Structured fixed income notes Vi
- Page 124 and 125: CategorY Estimated range of loss Lo
- Page 126 and 127: The main components of the cost of
- Page 128 and 129: 2.30 Foreign currency and indexatio
- Page 130 and 131: The most significant areas of estim
- Page 132 and 133: i. Pension insurances reserves This
- Page 134 and 135: 3.1 Main changes in the accounting
- Page 136 and 137:
Suspension of revenue recognition o
- Page 138 and 139:
) Summary of Consolidated Equity as
- Page 140 and 141:
3.3 Main adjustments made a) Invest
- Page 142 and 143:
NotE 5 - Income taxes Deferred tax
- Page 144 and 145:
Inmobiliaria Security S.A. measures
- Page 146 and 147:
NotE 8 - Investments in Associates
- Page 148 and 149:
NotE 9 - Property, Plant and Equipm
- Page 150 and 151:
) The amortization of intangible as
- Page 152 and 153:
NotE 13 - Other Financial Assets, C
- Page 154 and 155:
NotE 16 - Other Non-Financial Asset
- Page 156 and 157:
Detail of bank obligations as of De
- Page 158 and 159:
Detail of bank obligations as of Ja
- Page 160 and 161:
Detail of the bonds at December 31,
- Page 162 and 163:
NotE 19 - Other Non-Financial Liabi
- Page 164 and 165:
NotE 23 - Other Financial Liabiliti
- Page 166 and 167:
Note 24 - Non-Current Liabilities A
- Page 168 and 169:
) Cost of Sales The items includes
- Page 170 and 171:
NotE 26 - Administrative expenses T
- Page 172 and 173:
BALANCE 31.12.2010 31.12.2009 01.01
- Page 174 and 175:
Up to 1 year From 1 to 3 years From
- Page 176 and 177:
The management of Grupo Security S.
- Page 178 and 179:
c) Statement of Financial Position
- Page 180 and 181:
e) Statement of Financial Position
- Page 182 and 183:
2) Risk Management Structure Banco
- Page 184 and 185:
4º Credit Management Basically, th
- Page 186 and 187:
In the case of the Bank’s impaire
- Page 188 and 189:
These are the details of guarantees
- Page 190 and 191:
Loans that are classified individua
- Page 192 and 193:
Such limitations allow the Bank to
- Page 194 and 195:
Banco Security and its Subsidiaries
- Page 196 and 197:
Market risk trading ledger 31.12.20
- Page 198 and 199:
Regulatory Liquidity Mismatching as
- Page 200 and 201:
Regulatory Liquidity Mismatching as
- Page 202 and 203:
currency swaps). These derivatives
- Page 204 and 205:
Participants in the Credit Risk Com
- Page 206 and 207:
7) Regulatory Capital Requirement I
- Page 208 and 209:
6) Summary of the Policy for Invest
- Page 210 and 211:
d) Dividends The policy agreed by t
- Page 212 and 213:
The following table shows financial
- Page 214 and 215:
Valores Security S.A. Corredores de
- Page 216 and 217:
• The Board of Directors agreed t
- Page 218 and 219:
Note 37 - Subsequent Events On Janu
- Page 220 and 221:
MANAGEMENT’S ANALYSIS OF CONSOLID
- Page 222 and 223:
2.2 Factoring Industry Factoring ha
- Page 224 and 225:
5. Risk Factors 5.1 Dependence on d
- Page 226 and 227:
6 PERFORMANCE INDECATORS OF THE CON
- Page 228 and 229:
$ Pesos Chilenos MM$ Millones de Pe
- Page 230 and 231:
BANCO SECURITY AND SUBSIDIARIES Typ
- Page 232 and 233:
Banco Security and Subsidiaries Con
- Page 234 and 235:
Banco Security and Subsidiaries Con
- Page 236 and 237:
Valores Security S.A. Corredores de
- Page 238 and 239:
Administradora General de Fondos Se
- Page 240 and 241:
Factoring Security S.A. Type of ent
- Page 242 and 243:
Asesorias Security S.A. AND SUBSIDI
- Page 244 and 245:
Securitizadora Security S.A. Type o
- Page 246 and 247:
Global Asset Advisors Type of entit
- Page 248 and 249:
Inversiones Seguros Security Ltda A
- Page 250 and 251:
Seguros Vida Security Previsión S.
- Page 252 and 253:
Compañía de Seguros Generales Pen
- Page 254 and 255:
Servicios Security S.A. AND SUBSIDI
- Page 256 and 257:
Corredores de Seguros Security Ltda
- Page 258 and 259:
Europ Assistance Chile s.A. Type of
- Page 260 and 261:
Cooper Gay Chile S.A. Corredores de
- Page 262 and 263:
Inmobiliaria Security S.A. AND SUBS
- Page 264 and 265:
INVERSIONES INVEST SECURITY LTDA. A
- Page 266 and 267:
Travel Security S.A. AND SUBSIDIARI
- Page 268 and 269:
Global Security Gestión y Servicio
- Page 270 and 271:
Mandatos Security Ltda. Type of ent
- Page 272 and 273:
GROUP OWNERSHIP STRUCTURE The follo
- Page 274 and 275:
D E C L A R A T I O N O F R E S P O
- Page 276 and 277:
ADDRESSES OF COMPANIES OF GRUPO SEC
- Page 278 and 279:
Santa Elena Branch Santa Elena 2400
- Page 280 and 281:
Santiago Nueva York 33, Office 1402
- Page 282:
“THIS PAPER COMES FROM FORESTS MA