u8Zcc
u8Zcc
u8Zcc
Create successful ePaper yourself
Turn your PDF publications into a flip-book with our unique Google optimized e-Paper software.
Management’s Discussion (Continued)<br />
Utilities and Energy (“MidAmerican”) (Continued)<br />
PacifiCorp, MidAmerican Energy Company (“MEC”), as well as Nevada Power Company and Sierra Pacific Power Company<br />
(together, “NV Energy”). NV Energy was acquired on December 19, 2013. MidAmerican also owns two domestic regulated<br />
interstate natural gas pipeline companies. In Great Britain, MidAmerican subsidiaries operate two regulated electricity<br />
distribution businesses referred to as Northern Powergrid. The rates that our regulated businesses charge customers for energy<br />
and services are based in large part on the costs of business operations, including a return on capital, and are subject to<br />
regulatory approval. To the extent these operations are not allowed to include such costs in the approved rates, operating results<br />
will be adversely affected. In addition, MidAmerican also operates a diversified portfolio of independent power projects and the<br />
second-largest residential real estate brokerage firm and franchise network in the United States.<br />
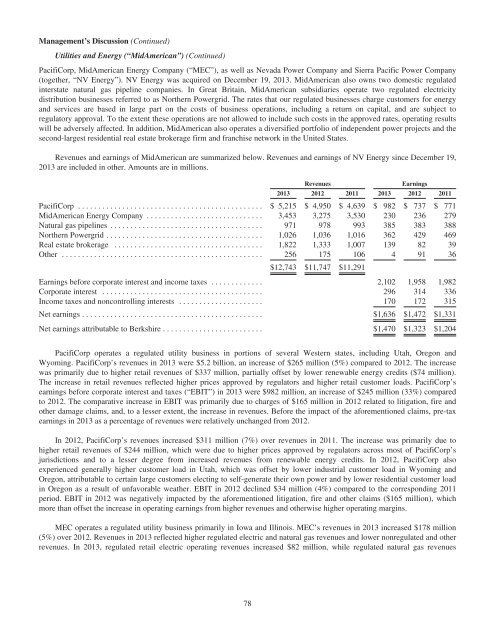
Revenues and earnings of MidAmerican are summarized below. Revenues and earnings of NV Energy since December 19,<br />
2013 are included in other. Amounts are in millions.<br />
Revenues<br />
Earnings<br />
2013 2012 2011 2013 2012 2011<br />
PacifiCorp .............................................. $ 5,215 $ 4,950 $ 4,639 $ 982 $ 737 $ 771<br />
MidAmerican Energy Company ............................. 3,453 3,275 3,530 230 236 279<br />
Natural gas pipelines ...................................... 971 978 993 385 383 388<br />
Northern Powergrid ....................................... 1,026 1,036 1,016 362 429 469<br />
Real estate brokerage ..................................... 1,822 1,333 1,007 139 82 39<br />
Other .................................................. 256 175 106 4 91 36<br />
$12,743 $11,747 $11,291<br />
Earnings before corporate interest and income taxes ............. 2,102 1,958 1,982<br />
Corporate interest ........................................ 296 314 336<br />
Income taxes and noncontrolling interests ..................... 170 172 315<br />
Net earnings ............................................. $1,636 $1,472 $1,331<br />
Net earnings attributable to Berkshire ......................... $1,470 $1,323 $1,204<br />
PacifiCorp operates a regulated utility business in portions of several Western states, including Utah, Oregon and<br />
Wyoming. PacifiCorp’s revenues in 2013 were $5.2 billion, an increase of $265 million (5%) compared to 2012. The increase<br />
was primarily due to higher retail revenues of $337 million, partially offset by lower renewable energy credits ($74 million).<br />
The increase in retail revenues reflected higher prices approved by regulators and higher retail customer loads. PacifiCorp’s<br />
earnings before corporate interest and taxes (“EBIT”) in 2013 were $982 million, an increase of $245 million (33%) compared<br />
to 2012. The comparative increase in EBIT was primarily due to charges of $165 million in 2012 related to litigation, fire and<br />
other damage claims, and, to a lesser extent, the increase in revenues. Before the impact of the aforementioned claims, pre-tax<br />
earnings in 2013 as a percentage of revenues were relatively unchanged from 2012.<br />
In 2012, PacifiCorp’s revenues increased $311 million (7%) over revenues in 2011. The increase was primarily due to<br />
higher retail revenues of $244 million, which were due to higher prices approved by regulators across most of PacifiCorp’s<br />
jurisdictions and to a lesser degree from increased revenues from renewable energy credits. In 2012, PacifiCorp also<br />
experienced generally higher customer load in Utah, which was offset by lower industrial customer load in Wyoming and<br />
Oregon, attributable to certain large customers electing to self-generate their own power and by lower residential customer load<br />
in Oregon as a result of unfavorable weather. EBIT in 2012 declined $34 million (4%) compared to the corresponding 2011<br />
period. EBIT in 2012 was negatively impacted by the aforementioned litigation, fire and other claims ($165 million), which<br />
more than offset the increase in operating earnings from higher revenues and otherwise higher operating margins.<br />
MEC operates a regulated utility business primarily in Iowa and Illinois. MEC’s revenues in 2013 increased $178 million<br />
(5%) over 2012. Revenues in 2013 reflected higher regulated electric and natural gas revenues and lower nonregulated and other<br />
revenues. In 2013, regulated retail electric operating revenues increased $82 million, while regulated natural gas revenues<br />
78


