Download pdf, 989kb - WHO Western Pacific Region - World Health ...
Download pdf, 989kb - WHO Western Pacific Region - World Health ...
Download pdf, 989kb - WHO Western Pacific Region - World Health ...

You also want an ePaper? Increase the reach of your titles
YUMPU automatically turns print PDFs into web optimized ePapers that Google loves.
A Review of Literature and Projects 2005<br />
(3) Contraceptive use and safe/<br />
unsafe sex<br />
The results of the fertility and family/<br />
population surveys carried out by the<br />
NFPB generated information on<br />
contraceptive use among married<br />
women. The rate increased almost seven<br />
times over four decades, from 8.8% in<br />
the mid-1960s to 55.8% in<br />
1994 (Table 6). There was also an<br />
increase among younger age groups.<br />
The prevalence of contraceptive use<br />
among the population is variable. In the<br />
NPFDB study, one-fifth of respondents<br />
said they had used condoms<br />
(21.5%), with lower rates for other<br />
methods: pills (6.1%); spermicides<br />
(2.2%); intrauterine devices (1.3%); and<br />
injectables (1.1%). In the Youth Sexuality<br />
Survey, when sexually active females were<br />
asked about “precautions to prevent<br />
pregnancy,” 90% of the in-school<br />
females questioned admitted to not<br />
taking any measures, but 60% of the outof-school<br />
females said that they did. On<br />
the other hand, about 30% of in-school<br />
males and 15% of out-of-school males<br />
said they took precautions to prevent<br />
pregnancy.<br />
In another study, conducted in Kuala<br />
Lumpur, only 37% of the sexually active<br />
teenage respondents said they used some<br />
form of birth control, even although the<br />
majority knew about birth control<br />
methods. By far the most common<br />
method used was the condom<br />
(51%), followed by oral contraceptives<br />
(18%) and withdrawal (15%). Among<br />
those who did not use any<br />
contraceptives, about half explained that<br />
sex was not much fun with<br />
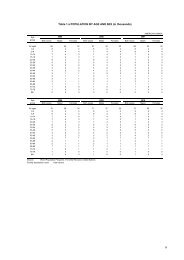
Table 6: Percentage distribution of currently married women aged 15-24 years who had ever used and were<br />
currently using contraception, by current age<br />
Survey<br />
WMFS 1966-67<br />
MFFS 1974<br />
MPFS 1984/85<br />
Sabah PFS 1989*<br />
Sarawak PFS 1989*<br />
MPFS 1994<br />
Ever used contraception Currently using contraception<br />
All 15-19 yr 20-24 yr All 15-19 yr 20-24 yr<br />
14<br />
10 9.1<br />
5.0<br />
53<br />
77<br />
72.0<br />
77.7<br />
Na<br />
23.7<br />
-<br />
41.3<br />
52.6<br />
Na<br />
45.4<br />
-<br />
58.1<br />
71.3<br />
Na<br />
35.3<br />
52.2<br />
50.1<br />
57.9<br />
55.8<br />
21.2<br />
31<br />
21.7<br />
37.2<br />
38.2<br />
53<br />
34.5<br />
51.6<br />
41.5<br />
Sources:(1) Report on the West Malaysian Family Survey 1966-1967. NFPB, 1968; (2) Malaysian Family<br />
and Fertility Survey 1974. NFPB; (3) Marriage and family formation in Peninsular Malaysia: analytical report<br />
of the 1984/85 Malaysian Population and Family Survey. NPFDB, 1988; (4) Population and Family Survey<br />
in Sabah 1989. NPFDB, 1992; (5) Report of the Population and Family Survey in Sarawak, 1989.<br />
NPFDB, 1992. (6) Population profile Malaysia. NPFDB, 1998.<br />
33