Download pdf, 989kb - WHO Western Pacific Region - World Health ...
Download pdf, 989kb - WHO Western Pacific Region - World Health ...
Download pdf, 989kb - WHO Western Pacific Region - World Health ...

Create successful ePaper yourself
Turn your PDF publications into a flip-book with our unique Google optimized e-Paper software.
Sexual and Reproductive <strong>Health</strong> of Adolescents and Youths in Malaysia<br />
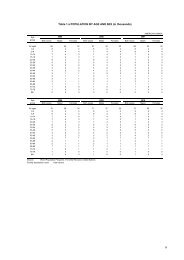
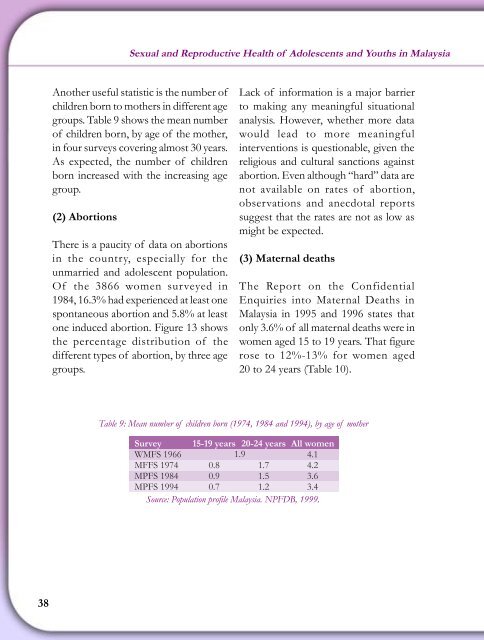
Another useful statistic is the number of<br />
children born to mothers in different age<br />
groups. Table 9 shows the mean number<br />
of children born, by age of the mother,<br />
in four surveys covering almost 30 years.<br />
As expected, the number of children<br />
born increased with the increasing age<br />
group.<br />
(2) Abortions<br />
There is a paucity of data on abortions<br />
in the country, especially for the<br />
unmarried and adolescent population.<br />
Of the 3866 women surveyed in<br />
1984, 16.3% had experienced at least one<br />
spontaneous abortion and 5.8% at least<br />
one induced abortion. Figure 13 shows<br />
the percentage distribution of the<br />
different types of abortion, by three age<br />
groups.<br />
Lack of information is a major barrier<br />
to making any meaningful situational<br />
analysis. However, whether more data<br />
would lead to more meaningful<br />
interventions is questionable, given the<br />
religious and cultural sanctions against<br />
abortion. Even although “hard” data are<br />
not available on rates of abortion,<br />
observations and anecdotal reports<br />
suggest that the rates are not as low as<br />
might be expected.<br />
(3) Maternal deaths<br />
The Report on the Confidential<br />
Enquiries into Maternal Deaths in<br />
Malaysia in 1995 and 1996 states that<br />
only 3.6% of all maternal deaths were in<br />
women aged 15 to 19 years. That figure<br />
rose to 12%-13% for women aged<br />
20 to 24 years (Table 10).<br />
Table 9: Mean number of children born (1974, 1984 and 1994), by age of mother<br />
Survey<br />
WMFS 1966<br />
MFFS 1974<br />
MPFS 1984<br />
MPFS 1994<br />
15-19 years 20-24 years<br />
1.9<br />
0.8 1.7<br />
0.9 1.5<br />
0.7 1.2<br />
All women<br />
4.1<br />
4.2<br />
3.6<br />
3.4<br />
Source: Population profile Malaysia. NPFDB, 1999.<br />
38