Pike Technologies Comprehensive Catalog of FTIR ... - Madatec
Pike Technologies Comprehensive Catalog of FTIR ... - Madatec
Pike Technologies Comprehensive Catalog of FTIR ... - Madatec

You also want an ePaper? Increase the reach of your titles
YUMPU automatically turns print PDFs into web optimized ePapers that Google loves.
P IKE T ECHNOLOGIES WWW. PIKETECH. COM 608-274-2721<br />
ATR – Theory and Applications<br />
Attenuated Total Reflectance (ATR) is today the most widely used<br />
<strong>FTIR</strong> sampling tool. ATR generally allows qualitative or quantitative<br />
analysis <strong>of</strong> samples with little or no sample preparation which<br />
greatly speeds sample analysis. The main benefit <strong>of</strong> ATR sampling<br />
comes from the very thin sampling path length and depth <strong>of</strong><br />
penetration <strong>of</strong> the IR beam into the sample. This is in contrast to<br />
traditional <strong>FTIR</strong> sampling by transmission where the sample must<br />
be diluted with IR transparent salt, pressed into a pellet or pressed to<br />
a thin film, prior to analysis to prevent totally absorbing bands in<br />
the infrared spectrum.<br />
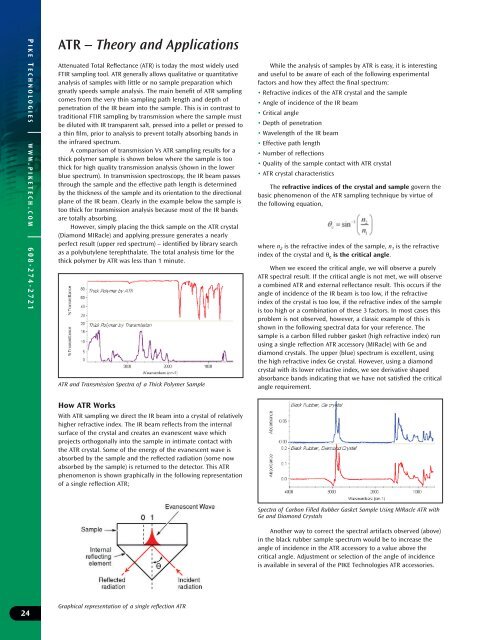
A comparison <strong>of</strong> transmission Vs ATR sampling results for a<br />
thick polymer sample is shown below where the sample is too<br />
thick for high quality transmission analysis (shown in the lower<br />
blue spectrum). In transmission spectroscopy, the IR beam passes<br />
through the sample and the effective path length is determined<br />
by the thickness <strong>of</strong> the sample and its orientation to the directional<br />
plane <strong>of</strong> the IR beam. Clearly in the example below the sample is<br />
too thick for transmission analysis because most <strong>of</strong> the IR bands<br />
are totally absorbing.<br />
However, simply placing the thick sample on the ATR crystal<br />
(Diamond MIRacle) and applying pressure generates a nearly<br />
perfect result (upper red spectrum) – identified by library search<br />
as a polybutylene terephthalate. The total analysis time for the<br />
thick polymer by ATR was less than 1 minute.<br />
ATR and Transmission Spectra <strong>of</strong> a Thick Polymer Sample<br />
How ATR Works<br />
With ATR sampling we direct the IR beam into a crystal <strong>of</strong> relatively<br />
higher refractive index. The IR beam reflects from the internal<br />
surface <strong>of</strong> the crystal and creates an evanescent wave which<br />
projects orthogonally into the sample in intimate contact with<br />
the ATR crystal. Some <strong>of</strong> the energy <strong>of</strong> the evanescent wave is<br />
absorbed by the sample and the reflected radiation (some now<br />
absorbed by the sample) is returned to the detector. This ATR<br />
phenomenon is shown graphically in the following representation<br />
<strong>of</strong> a single reflection ATR;<br />
While the analysis <strong>of</strong> samples by ATR is easy, it is interesting<br />
and useful to be aware <strong>of</strong> each <strong>of</strong> the following experimental<br />
factors and how they affect the final spectrum:<br />
• Refractive indices <strong>of</strong> the ATR crystal and the sample<br />
• Angle <strong>of</strong> incidence <strong>of</strong> the IR beam<br />
• Critical angle<br />
• Depth <strong>of</strong> penetration<br />
• Wavelength <strong>of</strong> the IR beam<br />
• Effective path length<br />
• Number <strong>of</strong> reflections<br />
• Quality <strong>of</strong> the sample contact with ATR crystal<br />
• ATR crystal characteristics<br />
The refractive indices <strong>of</strong> the crystal and sample govern the<br />
basic phenomenon <strong>of</strong> the ATR sampling technique by virtue <strong>of</strong><br />
the following equation,<br />
where n 2 is the refractive index <strong>of</strong> the sample, n 1 is the refractive<br />
index <strong>of</strong> the crystal and θ c is the critical angle.<br />
When we exceed the critical angle, we will observe a purely<br />
ATR spectral result. If the critical angle is not met, we will observe<br />
a combined ATR and external reflectance result. This occurs if the<br />
angle <strong>of</strong> incidence <strong>of</strong> the IR beam is too low, if the refractive<br />
index <strong>of</strong> the crystal is too low, if the refractive index <strong>of</strong> the sample<br />
is too high or a combination <strong>of</strong> these 3 factors. In most cases this<br />
problem is not observed, however, a classic example <strong>of</strong> this is<br />
shown in the following spectral data for your reference. The<br />
sample is a carbon filled rubber gasket (high refractive index) run<br />
using a single reflection ATR accessory (MIRacle) with Ge and<br />
diamond crystals. The upper (blue) spectrum is excellent, using<br />
the high refractive index Ge crystal. However, using a diamond<br />
crystal with its lower refractive index, we see derivative shaped<br />
absorbance bands indicating that we have not satisfied the critical<br />
angle requirement.<br />
Spectra <strong>of</strong> Carbon Filled Rubber Gasket Sample Using MIRacle ATR with<br />
Ge and Diamond Crystals<br />
Another way to correct the spectral artifacts observed (above)<br />
in the black rubber sample spectrum would be to increase the<br />
angle <strong>of</strong> incidence in the ATR accessory to a value above the<br />
critical angle. Adjustment or selection <strong>of</strong> the angle <strong>of</strong> incidence<br />
is available in several <strong>of</strong> the PIKE <strong>Technologies</strong> ATR accessories.<br />
24<br />
Graphical representation <strong>of</strong> a single reflection ATR