Download PDF version English(2664KB) - Hamon
Download PDF version English(2664KB) - Hamon
Download PDF version English(2664KB) - Hamon

You also want an ePaper? Increase the reach of your titles
YUMPU automatically turns print PDFs into web optimized ePapers that Google loves.
56<br />
<strong>Hamon</strong> Annual Report 2010<br />
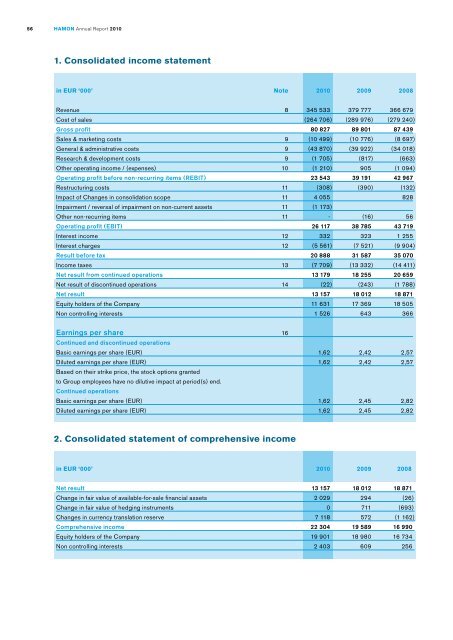
1. Consolidated income statement<br />
in EUR ‘000’ note 2010 2009 2008<br />
Revenue 8 345 533 379 777 366 679<br />
Cost of sales (264 706) (289 976) (279 240)<br />
Gross profit 80 827 89 801 87 439<br />
Sales & marketing costs 9 (10 499) (10 776) (8 697)<br />
General & administrative costs 9 (43 870) (39 922) (34 018)<br />
Research & development costs 9 (1 705) (817) (663)<br />
Other operating income / (expenses) 10 (1 210) 905 (1 094)<br />
Operating profit before non-recurring items (REBIT) 23 543 39 191 42 967<br />
Restructuring costs 11 (308) (390) (132)<br />
Impact of Changes in consolidation scope 11 4 055 828<br />
Impairment / reversal of impairment on non-current assets 11 (1 173)<br />
Other non-recurring items 11 - (16) 56<br />
Operating profit (EBIT) 26 117 38 785 43 719<br />
Interest income 12 332 323 1 255<br />
Interest charges 12 (5 561) (7 521) (9 904)<br />
Result before tax 20 888 31 587 35 070<br />
Income taxes 13 (7 709) (13 332) (14 411)<br />
Net result from continued operations 13 179 18 255 20 659<br />
Net result of discontinued operations 14 (22) (243) (1 788)<br />
Net result 13 157 18 012 18 871<br />
Equity holders of the Company 11 631 17 369 18 505<br />
Non controlling interests 1 526 643 366<br />
Earnings per share 16<br />
Continued and discontinued operations<br />
Basic earnings per share (EUR) 1,62 2,42 2,57<br />
Diluted earnings per share (EUR) 1,62 2,42 2,57<br />
Based on their strike price, the stock options granted<br />
to Group employees have no dilutive impact at period(s) end.<br />
Continued operations<br />
Basic earnings per share (EUR) 1,62 2,45 2,82<br />
Diluted earnings per share (EUR) 1,62 2,45 2,82<br />
2. Consolidated statement of comprehensive income<br />
in EUR ‘000’ 2010 2009 2008<br />
Net result 13 157 18 012 18 871<br />
Change in fair value of available-for-sale financial assets 2 029 294 (26)<br />
Change in fair value of hedging instruments 0 711 (693)<br />
Changes in currency translation reserve 7 118 572 (1 162)<br />
Comprehensive income 22 304 19 589 16 990<br />
Equity holders of the Company 19 901 18 980 16 734<br />
Non controlling interests 2 403 609 256