Download PDF version English(2664KB) - Hamon
Download PDF version English(2664KB) - Hamon
Download PDF version English(2664KB) - Hamon

You also want an ePaper? Increase the reach of your titles
YUMPU automatically turns print PDFs into web optimized ePapers that Google loves.
Part 3 - Financial Statements<br />
71<br />
Subsidiary Country % Group interest % Group interest<br />
2010 2009<br />
2. Subsidiaries consolidated by proportional integration<br />
<strong>Hamon</strong> Shriram Cottrell PVT Ltd India - 50%<br />
<strong>Hamon</strong> D’Hondt Middle East Company Ltd Saudi Arabia 39,64% 39,64%<br />
<strong>Hamon</strong> Cooling Towers Company FZCo United Arab Emirates 50% 50%<br />
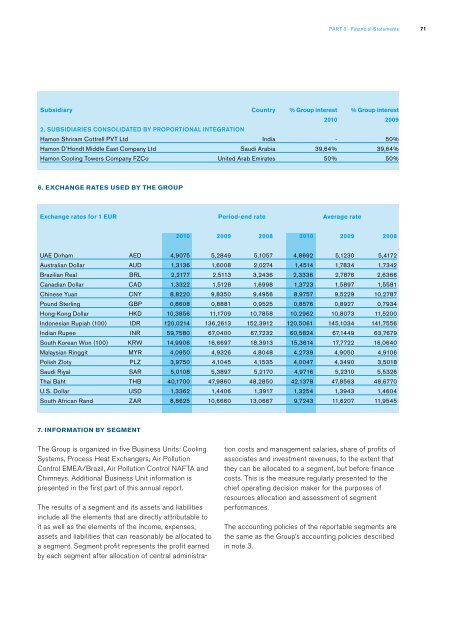
6. EXCHANGE RATES USED BY THE GROUP<br />
Exchange rates for 1 EUR Period-end rate Average rate<br />
2010 2009 2008 2010 2009 2008<br />
UAE Dirham AED 4,9075 5,2849 5,1057 4,8692 5,1230 5,4172<br />
Australian Dollar AUD 1,3136 1,6008 2,0274 1,4514 1,7834 1,7342<br />
Brazilian Real BRL 2,2177 2,5113 3,2436 2,3336 2,7876 2,6366<br />
Canadian Dollar CAD 1,3322 1,5128 1,6998 1,3723 1,5897 1,5581<br />
Chinese Yuan CNY 8,8220 9,8350 9,4956 8,9757 9,5229 10,2787<br />
Pound Sterling GBP 0,8608 0,8881 0,9525 0,8576 0,8927 0,7934<br />
Hong-Kong Dollar HKD 10,3856 11,1709 10,7858 10,2962 10,8073 11,5200<br />
Indonesian Rupiah (100) IDR 120,0214 136,2613 152,3912 120,5061 145,1034 141,7556<br />
Indian Rupee INR 59,7580 67,0400 67,7232 60,5824 67,1449 63,7679<br />
South Korean Won (100) KRW 14,9906 16,6697 18,3913 15,3614 17,7722 16,0640<br />
Malaysian Ringgit MYR 4,0950 4,9326 4,8048 4,2739 4,9050 4,9106<br />
Polish Zloty PLZ 3,9750 4,1045 4,1535 4,0047 4,3490 3,5018<br />
Saudi Riyal SAR 5,0108 5,3897 5,2170 4,9716 5,2310 5,5326<br />
Thai Baht THB 40,1700 47,9860 48,2850 42,1378 47,8563 48,6770<br />
U.S. Dollar USD 1,3362 1,4406 1,3917 1,3254 1,3943 1,4604<br />
South African Rand ZAR 8,8625 10,6660 13,0667 9,7243 11,6207 11,9545<br />
7. Information by segment<br />
The Group is organized in five Business Units: Cooling<br />
Systems, Process Heat Exchangers, Air Pollution<br />
Control EMEA/Brazil, Air Pollution Control NAFTA and<br />
Chimneys. Additional Business Unit information is<br />
presented in the first part of this annual report.<br />
The results of a segment and its assets and liabilities<br />
include all the elements that are directly attributable to<br />
it as well as the elements of the income, expenses,<br />
assets and liabilities that can reasonably be allocated to<br />
a segment. Segment profit represents the profit earned<br />
by each segment after allocation of central administration<br />
costs and management salaries, share of profits of<br />
associates and investment revenues, to the extent that<br />
they can be allocated to a segment, but before finance<br />
costs. This is the measure regularly presented to the<br />
chief operating decision maker for the purposes of<br />
resources allocation and assessment of segment<br />
performances.<br />
The accounting policies of the reportable segments are<br />
the same as the Group’s accounting policies described<br />
in note 3.