13.2 The Wallis Lake Estuary Management Committee - Great Lakes ...
13.2 The Wallis Lake Estuary Management Committee - Great Lakes ...
13.2 The Wallis Lake Estuary Management Committee - Great Lakes ...

Create successful ePaper yourself
Turn your PDF publications into a flip-book with our unique Google optimized e-Paper software.
<strong>Wallis</strong> <strong>Lake</strong> <strong>Estuary</strong> <strong>Management</strong> Plan<br />
2 <strong>The</strong> management area<br />
2.1 Location and environmental characteristics<br />
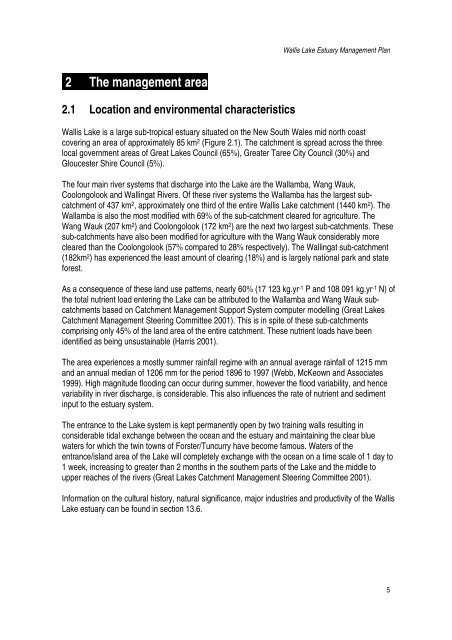
<strong>Wallis</strong> <strong>Lake</strong> is a large sub-tropical estuary situated on the New South Wales mid north coast<br />
covering an area of approximately 85 km 2 (Figure 2.1). <strong>The</strong> catchment is spread across the three<br />
local government areas of <strong>Great</strong> <strong>Lake</strong>s Council (65%), <strong>Great</strong>er Taree City Council (30%) and<br />
Gloucester Shire Council (5%).<br />
<strong>The</strong> four main river systems that discharge into the <strong>Lake</strong> are the Wallamba, Wang Wauk,<br />
Coolongolook and Wallingat Rivers. Of these river systems the Wallamba has the largest subcatchment<br />
of 437 km 2 , approximately one third of the entire <strong>Wallis</strong> <strong>Lake</strong> catchment (1440 km 2 ). <strong>The</strong><br />
Wallamba is also the most modified with 69% of the sub-catchment cleared for agriculture. <strong>The</strong><br />
Wang Wauk (207 km 2 ) and Coolongolook (172 km 2 ) are the next two largest sub-catchments. <strong>The</strong>se<br />
sub-catchments have also been modified for agriculture with the Wang Wauk considerably more<br />
cleared than the Coolongolook (57% compared to 28% respectively). <strong>The</strong> Wallingat sub-catchment<br />
(182km 2 ) has experienced the least amount of clearing (18%) and is largely national park and state<br />
forest.<br />
As a consequence of these land use patterns, nearly 60% (17 123 kg.yr -1 P and 108 091 kg.yr -1 N) of<br />
the total nutrient load entering the <strong>Lake</strong> can be attributed to the Wallamba and Wang Wauk subcatchments<br />
based on Catchment <strong>Management</strong> Support System computer modelling (<strong>Great</strong> <strong>Lake</strong>s<br />
Catchment <strong>Management</strong> Steering <strong>Committee</strong> 2001). This is in spite of these sub-catchments<br />
comprising only 45% of the land area of the entire catchment. <strong>The</strong>se nutrient loads have been<br />
identified as being unsustainable (Harris 2001).<br />
<strong>The</strong> area experiences a mostly summer rainfall regime with an annual average rainfall of 1215 mm<br />
and an annual median of 1206 mm for the period 1896 to 1997 (Webb, McKeown and Associates<br />
1999). High magnitude flooding can occur during summer, however the flood variability, and hence<br />
variability in river discharge, is considerable. This also influences the rate of nutrient and sediment<br />
input to the estuary system.<br />
<strong>The</strong> entrance to the <strong>Lake</strong> system is kept permanently open by two training walls resulting in<br />
considerable tidal exchange between the ocean and the estuary and maintaining the clear blue<br />
waters for which the twin towns of Forster/Tuncurry have become famous. Waters of the<br />
entrance/island area of the <strong>Lake</strong> will completely exchange with the ocean on a time scale of 1 day to<br />
1 week, increasing to greater than 2 months in the southern parts of the <strong>Lake</strong> and the middle to<br />
upper reaches of the rivers (<strong>Great</strong> <strong>Lake</strong>s Catchment <strong>Management</strong> Steering <strong>Committee</strong> 2001).<br />
Information on the cultural history, natural significance, major industries and productivity of the <strong>Wallis</strong><br />
<strong>Lake</strong> estuary can be found in section 13.6.<br />
5