
You also want an ePaper? Increase the reach of your titles
YUMPU automatically turns print PDFs into web optimized ePapers that Google loves.
6 <strong>The</strong> <strong>Link</strong> Real Estate Investment Trust <strong>Annual</strong> <strong>Report</strong> <strong>2007</strong><br />
Financial Highlights<br />
Year ended Period ended Changes<br />
31 March <strong>2007</strong> 31 March 2006 (3) %<br />
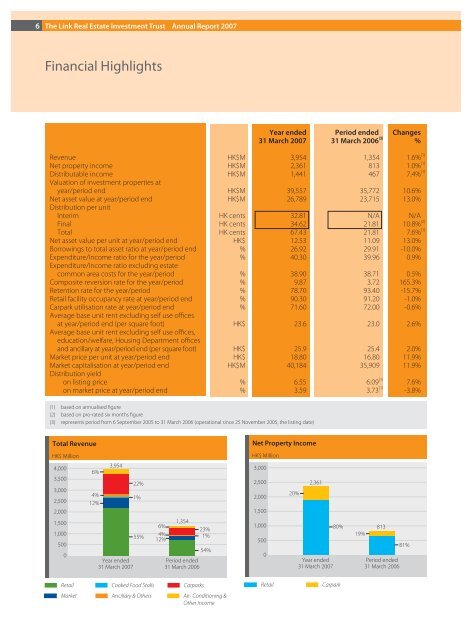
Revenue HK$M 3,954 1,354 1.6% (1)<br />
Net property income HK$M 2,361 813 1.0% (1)<br />
Distributable income HK$M 1,441 467 7.4% (1)<br />
Valuation of investment properties at<br />
year/period end HK$M 39,557 35,772 10.6%<br />
Net asset value at year/period end HK$M 26,789 23,715 13.0%<br />
Distribution per unit<br />
Interim HK cents 32.81 N/A N/A<br />
Final HK cents 34.62 21.81 10.8% (2)<br />
Total HK cents 67.43 21.81 7.6% (1)<br />
Net asset value per unit at year/period end HK$ 12.53 11.09 13.0%<br />
Borrowings to total asset ratio at year/period end % 26.92 29.91 -10.0%<br />
Expenditure/Income ratio for the year/period % 40.30 39.96 0.9%<br />
Expenditure/Income ratio excluding estate<br />
common area costs for the year/period % 38.90 38.71 0.5%<br />
Composite reversion rate for the year/period % 9.87 3.72 165.3%<br />
Retention rate for the year/period % 78.70 93.40 -15.7%<br />
Retail facility occupancy rate at year/period end % 90.30 91.20 -1.0%<br />
Carpark utilisation rate at year/period end % 71.60 72.00 -0.6%<br />
Average base unit rent excluding self use offices<br />
at year/period end (per square foot) HK$ 23.6 23.0 2.6%<br />
Average base unit rent excluding self use offices,<br />
education/welfare, Housing Department offices<br />
and ancillary at year/period end (per square foot) HK$ 25.9 25.4 2.0%<br />
Market price per unit at year/period end HK$ 18.80 16.80 11.9%<br />
Market capitalisation at year/period end HK$M 40,184 35,909 11.9%<br />
Distribution yield<br />
on listing price % 6.55 6.09 (1) 7.6%<br />
on market price at year/period end % 3.59 3.73 (1) -3.8%<br />
(1) based on annualised figure<br />
(2) based on pro-rated six months figure<br />
(3) represents period from 6 September 2005 to 31 March 2006 (operational since 25 November 2005, the listing date)<br />
Total Revenue<br />
Net Property Income<br />
HK$ Million<br />
HK$ Million<br />
4,000<br />
3,500<br />
3,000<br />
2,500<br />
2,000<br />
1,500<br />
1,000<br />
500<br />
0<br />
6%<br />
4%<br />
12%<br />
3,954<br />
Year ended<br />
31 March <strong>2007</strong><br />
22%<br />
1%<br />
55%<br />
6%<br />
4%<br />
12%<br />
1,354<br />
Period ended<br />
31 March 2006<br />
23%<br />
1%<br />
54%<br />
3,000<br />
2,500<br />
2,000<br />
1,500<br />
1,000<br />
500<br />
0<br />
20%<br />
2,361<br />
Year ended<br />
31 March <strong>2007</strong><br />
80%<br />
19%<br />
813<br />
Period ended<br />
31 March 2006<br />
81%<br />
Retail<br />
Cooked Food Stalls<br />
Carparks<br />
Retail<br />
Carpark<br />
Market<br />
Ancillary & Others<br />
Air- Conditioning &<br />
Other Income