

Portfolio report - Mangaung.co.za
Portfolio report - Mangaung.co.za
Portfolio report - Mangaung.co.za

Create successful ePaper yourself
Turn your PDF publications into a flip-book with our unique Google optimized e-Paper software.
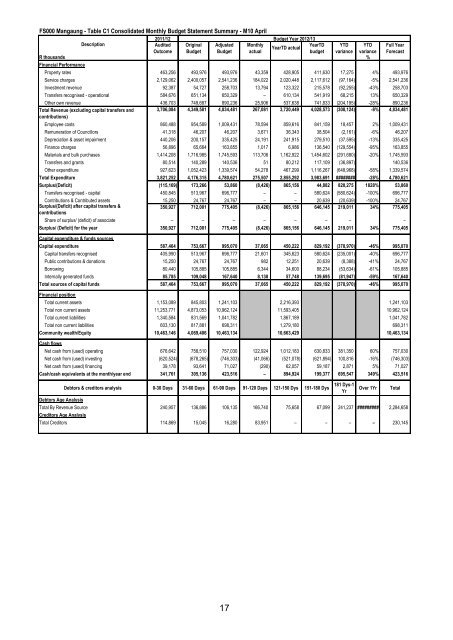
FS000 <strong>Mangaung</strong> - Table C1 Consolidated Monthly Budget Statement Summary - M10 April<br />
2011/12<br />
Budget Year 2012/13<br />
Description<br />
Audited Original Adjusted Monthly<br />
YearTD YTD YTD<br />
YearTD actual<br />
Out<strong>co</strong>me Budget Budget actual<br />
budget variance variance<br />
R thousands %<br />
Financial Performance<br />
Full Year<br />
Forecast<br />
Property rates 463,256 493,976 493,976 43,359 428,905 411,630 17,275 4% 493,976<br />
Service charges 2,129,062 2,400,057 2,541,236 184,022 2,020,448 2,117,612 (97,164) -5% 2,541,236<br />
Investment revenue 92,387 54,727 258,703 13,794 123,322 215,578 (92,255) -43% 258,703<br />
Transfers re<strong>co</strong>gnised - operational 584,676 651,134 650,329 – 610,134 541,919 68,215 13% 650,329<br />
Other own revenue 436,703 749,687 890,236 25,906 537,638 741,833 (204,195) -28% 890,236<br />
Total Revenue (excluding capital transfers and<br />
3,706,084 4,349,581 4,834,481 267,081 3,720,449 4,028,573 (308,124) -8% 4,834,481<br />
<strong>co</strong>ntributions)<br />
Employee <strong>co</strong>sts 860,488 954,589 1,009,431 78,594 859,616 841,159 18,457 2% 1,009,431<br />
Remuneration of Councillors 41,318 46,207 46,207 3,671 36,343 38,504 (2,161) -6% 46,207<br />
Depreciation & asset impairment 440,206 200,157 335,425 24,191 241,915 279,510 (37,595) -13% 335,425<br />
Finance charges 56,896 65,664 163,855 1,017 6,986 136,540 (129,554) -95% 163,855<br />
Materials and bulk purchases 1,414,208 1,716,985 1,745,593 113,706 1,162,922 1,454,602 (291,680) -20% 1,745,593<br />
Transfers and grants 80,514 140,289 140,536 51 80,212 117,109 (36,897) 140,536<br />
Other expenditure 927,623 1,052,423 1,339,574 54,278 467,299 1,116,267 (648,968) -58% 1,339,574<br />
Total Expenditure 3,821,252 4,176,315 4,780,621 275,507 2,855,292 3,983,691 ######## -28% 4,780,621<br />
Surplus/(Deficit) (115,169) 173,266 53,860 (8,426) 865,156 44,882 820,275 1828% 53,860<br />
Transfers re<strong>co</strong>gnised - capital 450,845 513,967 696,777 – – 580,624 (580,624) -100% 696,777<br />
Contributions & Contributed assets 15,250 24,767 24,767 – – 20,639 (20,639) -100% 24,767<br />
Surplus/(Deficit) after capital transfers &<br />
350,927 712,001 775,405 (8,426) 865,156 646,145 219,011 34% 775,405<br />
<strong>co</strong>ntributions<br />
Share of surplus/ (deficit) of associate – – – – – – – –<br />
Surplus/ (Deficit) for the year 350,927 712,001 775,405 (8,426) 865,156 646,145 219,011 34% 775,405<br />
Capital expenditure & funds sources<br />
Capital expenditure 587,464 753,667 995,070 37,065 450,222 829,192 (378,970) -46% 995,070<br />
Capital transfers re<strong>co</strong>gnised 405,990 513,967 696,777 21,601 345,623 580,624 (235,001) -40% 696,777<br />
Public <strong>co</strong>ntributions & donations 15,250 24,767 24,767 982 12,251 20,639 (8,388) -41% 24,767<br />
Borrowing 80,440 105,885 105,885 6,344 34,600 88,234 (53,634) -61% 105,885<br />
Internally generated funds 85,785 109,048 167,640 8,138 57,748 139,695 (81,947) -59% 167,640<br />
Total sources of capital funds 587,464 753,667 995,070 37,065 450,222 829,192 (378,970) -46% 995,070<br />
Financial position<br />
Total current assets 1,153,089 845,803 1,241,103 2,216,393 1,241,103<br />
Total non current assets 11,253,771 4,873,053 10,962,124 11,593,405 10,962,124<br />
Total current liabilities 1,340,584 831,569 1,041,782 1,867,189 1,041,782<br />
Total non current liabilities 603,130 817,881 698,311 1,279,180 698,311<br />
Community wealth/Equity 10,463,146 4,069,406 10,463,134 10,663,429 10,463,134<br />
Cash flows<br />
Net cash from (used) operating 676,642 758,510 757,030 122,924 1,012,183 630,833 381,350 60% 757,030<br />
Net cash from (used) investing (620,524) (678,265) (746,303) (41,066) (521,078) (621,894) 100,816 -16% (746,303)<br />
Net cash from (used) financing 39,178 93,641 71,027 (290) 62,057 59,187 2,871 5% 71,027<br />
Cash/cash equivalents at the month/year end 341,761 305,136 423,516 – 894,924 199,377 695,547 349% 423,516<br />
Debtors Age Analysis<br />
Debtors & creditors analysis 0-30 Days 31-60 Days 61-90 Days 91-120 Days 121-150 Dys 151-180 Dys<br />
181 Dys-1<br />
Yr<br />
Total By Revenue Source 240,957 136,886 106,135 166,740 75,658 67,099 241,237 ######### 2,284,658<br />
Creditors Age Analysis<br />
Total Creditors 114,869 15,045 16,280 83,951 – – – – 230,145<br />
Over 1Yr<br />
Total<br />
17


