

Portfolio report - Mangaung.co.za
Portfolio report - Mangaung.co.za
Portfolio report - Mangaung.co.za

You also want an ePaper? Increase the reach of your titles
YUMPU automatically turns print PDFs into web optimized ePapers that Google loves.
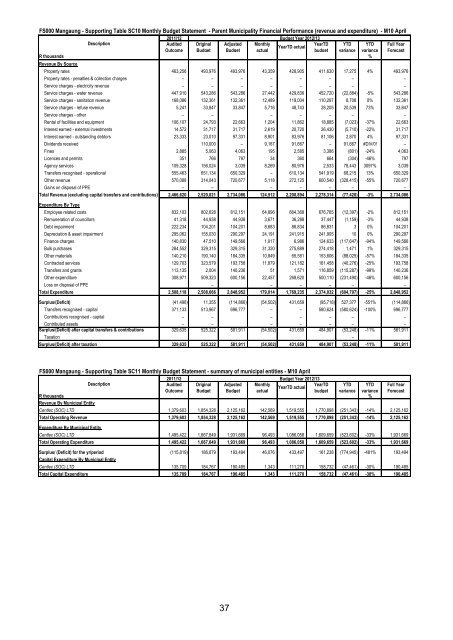
FS000 <strong>Mangaung</strong> - Supporting Table SC10 Monthly Budget Statement - Parent Municipality Financial Performance (revenue and expenditure) - M10 April<br />
2011/12 Budget Year 2012/13<br />
Description<br />
Audited Original Adjusted Monthly<br />
YearTD YTD YTD Full Year<br />
YearTD actual<br />
Out<strong>co</strong>me Budget Budget actual<br />
budget variance variance Forecast<br />
R thousands %<br />
Revenue By Source<br />
Property rates 463,256 493,976 493,976 43,359 428,905 411,630 17,275 4% 493,976<br />
Property rates - penalties & <strong>co</strong>llection charges – – – – – – – –<br />
Service charges - electricity revenue – – – – – – – –<br />
Service charges - water revenue 447,910 543,286 543,286 27,442 429,836 452,720 (22,884) -5% 543,286<br />
Service charges - sanitation revenue 168,086 132,361 132,361 12,489 119,004 110,297 8,708 8% 132,361<br />
Service charges - refuse revenue 5,241 33,847 33,847 5,716 48,743 28,205 20,539 73% 33,847<br />
Service charges - other – – – – – – –<br />
Rental of facilities and equipment 106,107 24,793 22,663 1,204 11,862 18,885 (7,023) -37% 22,663<br />
Interest earned - external investments 14,572 31,717 31,717 2,619 20,720 26,430 (5,710) -22% 31,717<br />
Interest earned - outstanding debtors 23,333 23,010 97,331 8,901 83,976 81,106 2,870 4% 97,331<br />
Dividends received 110,000 – 9,167 91,667 – 91,667 #DIV/0! –<br />
Fines 2,885 5,063 4,063 195 2,585 3,386 (801) -24% 4,063<br />
Licences and permits 351 766 797 34 360 664 (304) -46% 797<br />
Agency services 109,328 156,024 3,039 8,269 80,976 2,533 78,443 3097% 3,039<br />
Transfers re<strong>co</strong>gnised - operational 555,463 651,134 650,329 – 610,134 541,919 68,215 13% 650,329<br />
Other revenue 570,088 314,043 720,677 5,118 272,125 600,540 (328,415) -55% 720,677<br />
Gains on disposal of PPE – – – – – – –<br />
Total Revenue (excluding capital transfers and <strong>co</strong>ntributions) 2,466,620 2,520,021 2,734,086 124,512 2,200,894 2,278,314 (77,420) -3% 2,734,086<br />
Expenditure By Type<br />
Employee related <strong>co</strong>sts 832,103 802,628 812,151 64,896 664,368 676,765 (12,397) -2% 812,151<br />
Remuneration of <strong>co</strong>uncillors 41,318 44,938 44,938 3,671 36,288 37,447 (1,159) -3% 44,938<br />
Debt impairment 222,234 104,201 104,201 8,683 86,834 86,831 3 0% 104,201<br />
Depreciation & asset impairment 295,062 155,030 290,297 24,191 241,915 241,905 10 0% 290,297<br />
Finance charges 140,830 47,510 149,566 1,017 6,986 124,633 (117,647) -94% 149,566<br />
Bulk purchases 284,552 329,315 329,315 31,320 275,889 274,418 1,471 1% 329,315<br />
Other materials 140,210 190,140 184,335 10,849 65,581 153,606 (88,025) -57% 184,335<br />
Contracted services 129,703 323,579 193,758 11,879 121,182 161,458 (40,276) -25% 193,758<br />
Transfers and grants 113,135 2,004 140,236 51 1,571 116,859 (115,287) -99% 140,236<br />
Other expenditure 308,971 509,323 600,156 22,457 268,620 500,110 (231,490) -46% 600,156<br />
Loss on disposal of PPE – – – – – –<br />
Total Expenditure 2,508,118 2,508,666 2,848,952 179,014 1,769,235 2,374,032 (604,797) -25% 2,848,952<br />
–<br />
Surplus/(Deficit) (41,498) 11,355 (114,866) (54,502) 431,659 (95,718) 527,377 -551% (114,866)<br />
Transfers re<strong>co</strong>gnised - capital 371,133 513,967 696,777 – – 580,624 (580,624) -100% 696,777<br />
Contributions re<strong>co</strong>gnised - capital – – – – – – –<br />
Contributed assets – – – – – – –<br />
Surplus/(Deficit) after capital transfers & <strong>co</strong>ntributions 329,635 525,322 581,911 (54,502) 431,659 484,907 (53,248) -11% 581,911<br />
Taxation –<br />
Surplus/(Deficit) after taxation 329,635 525,322 581,911 (54,502) 431,659 484,907 (53,248) -11% 581,911<br />
FS000 <strong>Mangaung</strong> - Supporting Table SC11 Monthly Budget Statement - summary of municipal entities - M10 April<br />
2011/12<br />
Budget Year 2012/13<br />
Description<br />
Audited Original Adjusted Monthly<br />
YearTD YTD YTD<br />
YearTD actual<br />
Out<strong>co</strong>me Budget Budget actual<br />
budget variance variance<br />
R thousands %<br />
Revenue By Municipal Entity<br />
Full Year<br />
Forecast<br />
Centlec (SOC) LTD 1,379,603 1,854,328 2,125,162 142,569 1,519,555 1,770,898 (251,343) -14% 2,125,162<br />
Total Operating Revenue 1,379,603 1,854,328 2,125,162 142,569 1,519,555 1,770,898 (251,343) -14% 2,125,162<br />
Expenditure By Municipal Entity<br />
Centlec (SOC) LTD 1,495,422 1,667,649 1,931,669 96,493 1,086,058 1,609,659 (523,602) -33% 1,931,669<br />
Total Operating Expenditure 1,495,422 1,667,649 1,931,669 96,493 1,086,058 1,609,659 (523,602) -33% 1,931,669<br />
Surplus/ (Deficit) for the yr/period (115,819) 186,679 193,494 46,076 433,497 161,238 (774,945) -481% 193,494<br />
Capital Expenditure By Municipal Entity<br />
Centlec (SOC) LTD 135,709 184,767 190,485 1,343 111,270 158,732 (47,461) -30% 190,485<br />
Total Capital Expenditure 135,709 184,767 190,485 1,343 111,270 158,732 (47,461) -30% 190,485<br />
37


