

Portfolio report - Mangaung.co.za
Portfolio report - Mangaung.co.za
Portfolio report - Mangaung.co.za

Create successful ePaper yourself
Turn your PDF publications into a flip-book with our unique Google optimized e-Paper software.
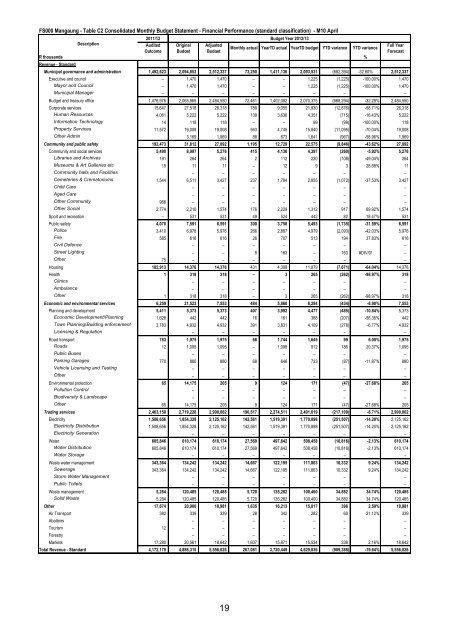
FS000 <strong>Mangaung</strong> - Table C2 Consolidated Monthly Budget Statement - Financial Performance (standard classification) - M10 April<br />
2011/12 Budget Year 2012/13<br />
Description<br />
Audited Original Adjusted<br />
Monthly actual YearTD actual YearTD budget YTD variance YTD variance<br />
Out<strong>co</strong>me Budget Budget<br />
R thousands %<br />
Revenue - Standard<br />
Full Year<br />
Forecast<br />
Municipal governance and administration 1,492,623 2,094,853 2,512,337 73,250 1,411,136 2,093,531 (682,394) -32.60% 2,512,337<br />
Executive and <strong>co</strong>uncil – 1,470 1,470 – – 1,225 (1,225) -100.00% 1,470<br />
Mayor and Council – 1,470 1,470 – – 1,225 (1,225) -100.00% 1,470<br />
Municipal Manager – – – – – – – –<br />
Budget and treasury office 1,476,976 2,065,865 2,484,550 72,461 1,402,082 2,070,375 (668,294) -32.28% 2,484,550<br />
Corporate services 15,647 27,518 26,318 789 9,055 21,930 (12,876) -58.71% 26,318<br />
Human Resources 4,061 5,222 5,222 139 3,636 4,351 (715) -16.43% 5,222<br />
Information Technology 14 118 118 – – 99 (99) -100.00% 118<br />
Property Services 11,572 19,008 19,008 563 4,745 15,840 (11,095) -70.04% 19,008<br />
Other Admin 3,169 1,969 88 673 1,641 (967) -58.96% 1,969<br />
Community and public safety 192,473 31,812 27,092 1,195 12,729 22,575 (9,846) -43.62% 27,092<br />
Community and social services 5,490 8,997 5,276 415 4,136 4,397 (260) -5.92% 5,276<br />
Libraries and Archives 191 264 264 2 112 220 (108) -49.04% 264<br />
Museums & Art Galleries etc 15 11 11 – 12 9 3 28.68% 11<br />
Community halls and Facilities – – – – – – –<br />
Cemeteries & Crematoriums 1,544 6,511 3,427 237 1,784 2,855 (1,072) -37.53% 3,427<br />
Child Care – – – – – – –<br />
Aged Care – – – – – – –<br />
Other Community 966 – – – – – – –<br />
Other Social 2,774 2,210 1,574 176 2,229 1,312 917 69.92% 1,574<br />
Sport and recreation – 531 531 49 524 442 82 18.47% 531<br />
Public safety 4,070 7,591 6,591 300 3,758 5,493 (1,735) -31.59% 6,591<br />
Police 3,410 6,976 5,976 266 2,887 4,979 (2,093) -42.03% 5,976<br />
Fire 585 616 616 26 707 513 194 37.83% 616<br />
Civil Defence – – – – – – –<br />
Street Lighting – – 8 163 – 163 #DIV/0! –<br />
Other 75 – – – – – – –<br />
Housing 182,913 14,376 14,376 431 4,308 11,979 (7,671) -64.04% 14,376<br />
Health 1 318 318 – 3 265 (262) -98.97% 318<br />
Clinics – – – – – – –<br />
Ambulance – – – – – – –<br />
Other 1 318 318 – 3 265 (262) -98.97% 318<br />
E<strong>co</strong>nomic and environmental services 6,259 21,523 7,553 484 5,860 6,294 (434) -6.90% 7,553<br />
Planning and development 5,411 5,373 5,373 407 3,992 4,477 (485) -10.84% 5,373<br />
E<strong>co</strong>nomic Development/Planning 1,628 442 442 16 161 368 (207) -56.35% 442<br />
Town Planning/Building enforcement 3,783 4,932 4,932 391 3,831 4,109 (278) -6.77% 4,932<br />
Licensing & Regulation – – – – – – –<br />
Road transport 783 1,975 1,975 68 1,744 1,645 99 6.00% 1,975<br />
Roads 12 1,095 1,095 – 1,098 912 186 20.37% 1,095<br />
Public Buses – – – – – – –<br />
Parking Garages 770 880 880 68 646 733 (87) -11.87% 880<br />
Vehicle Licensing and Testing – – – – – – –<br />
Other – – – – – – –<br />
Environmental protection 65 14,175 205 9 124 171 (47) -27.68% 205<br />
Pollution Control – – – – – – –<br />
Biodiversity & Landscape – – – – – – –<br />
Other 65 14,175 205 9 124 171 (47) -27.68% 205<br />
Trading services 2,463,150 2,719,228 2,990,062 190,517 2,274,511 2,491,619 (217,109) -8.71% 2,990,062<br />
Electricity 1,508,656 1,854,328 2,125,162 142,561 1,519,391 1,770,898 (251,507) -14.20% 2,125,162<br />
Electricity Distribution 1,508,656 1,854,328 2,125,162 142,561 1,519,391 1,770,898 (251,507) -14.20% 2,125,162<br />
Electricity Generation – – – – – – –<br />
Water 605,846 610,174 610,174 27,569 497,642 508,458 (10,816) -2.13% 610,174<br />
Water Distribution 605,846 610,174 610,174 27,569 497,642 508,458 (10,816) -2.13% 610,174<br />
Water Storage – – – – – – –<br />
Waste water management 343,364 134,242 134,242 14,667 122,195 111,863 10,332 9.24% 134,242<br />
Sewerage 343,364 134,242 134,242 14,667 122,195 111,863 10,332 9.24% 134,242<br />
Storm Water Management – – – – – – –<br />
Public Toilets – – – – – – –<br />
Waste management 5,284 120,485 120,485 5,720 135,282 100,400 34,882 34.74% 120,485<br />
Solid Waste 5,284 120,485 120,485 5,720 135,282 100,400 34,882 34.74% 120,485<br />
Other 17,674 20,900 18,981 1,635 16,213 15,817 396 2.50% 18,981<br />
Air Transport 382 339 339 28 342 282 60 21.12% 339<br />
Abattoirs – – – – – – –<br />
Tourism 12 – – – – – – –<br />
Forestry – – – – – – –<br />
Markets 17,280 20,561 18,642 1,607 15,871 15,534 336 2.16% 18,642<br />
Total Revenue - Standard 4,172,179 4,888,315 5,556,026 267,081 3,720,449 4,629,836 (909,388) -19.64% 5,556,026<br />
19


