Expenditure - Standard Municipal governance and administration 1,054,990 1,166,500 1,249,908 57,786 643,875 1,041,548 (397,673) -38.18% 1,249,908 Executive and <strong>co</strong>uncil 112,221 236,363 240,591 15,111 159,459 200,484 (41,025) -20.46% 240,591 Mayor and Council 105,459 226,841 231,051 14,624 153,541 192,535 (38,994) -20.25% 231,051 Municipal Manager 6,762 9,522 9,539 487 5,917 7,949 (2,032) -25.56% 9,539 Budget and treasury office 828,321 662,142 738,343 18,326 255,223 615,261 (360,038) -58.52% 738,343 Corporate services 114,448 267,995 270,974 24,349 229,193 225,803 3,390 1.50% 270,974 Human Resources 30,836 39,539 40,334 2,884 30,818 33,610 (2,792) -8.31% 40,334 Information Technology 55,651 74,923 71,050 6,407 48,817 59,206 (10,390) -17.55% 71,050 Property Services 27,961 64,443 62,953 3,486 34,267 52,459 (18,192) -34.68% 62,953 Other Admin – 89,090 96,637 11,571 115,292 80,528 34,764 43.17% 96,637 Community and public safety 283,949 317,651 345,943 24,024 240,346 288,275 (47,928) -16.63% 345,943 Community and social services 100,702 98,899 112,075 7,285 74,171 93,392 (19,221) -20.58% 112,075 Libraries and Archives 14,980 17,698 19,452 1,307 12,262 16,210 (3,948) -24.35% 19,452 Museums & Art Galleries etc 1,291 1,532 1,496 111 1,123 1,247 (123) -9.91% 1,496 Community halls and Facilities – – – – – – – Cemeteries & Crematoriums 16,171 15,662 17,551 1,222 13,364 14,625 (1,261) -8.62% 17,551 Child Care – – – – – – – Aged Care – – – – – – – Other Community 35,748 – – – – – – – Other Social 32,512 64,007 73,576 4,644 47,422 61,311 (13,889) -22.65% 73,576 Sport and recreation 5,880 4,439 4,234 235 1,962 3,528 (1,567) -44.40% 4,234 Public safety 134,104 168,163 177,505 12,932 128,707 147,915 (19,207) -12.99% 177,505 Police 79,243 103,171 110,018 7,792 81,085 91,678 (10,593) -11.55% 110,018 Fire 45,161 50,750 52,263 4,441 41,210 43,551 (2,341) -5.38% 52,263 Civil Defence – – – – – – Street Lighting 10,699 3,533 514 4,336 2,944 1,392 47.28% 3,533 Other 9,699 3,543 11,690 185 2,077 9,741 (7,665) -78.68% 11,690 Housing 38,894 36,165 41,686 2,847 28,015 34,737 (6,721) -19.35% 41,686 Health 4,370 9,985 10,444 725 7,490 8,703 (1,212) -13.93% 10,444 Clinics – – – – – – – Ambulance – – – – – – – Other 4,370 9,985 10,444 725 7,490 8,703 (1,212) -13.93% 10,444 E<strong>co</strong>nomic and environmental services 652,537 279,065 389,668 26,742 232,647 324,710 (92,063) -28.35% 389,668 Planning and development 68,766 77,737 72,210 3,363 31,612 60,173 (28,560) -47.46% 72,210 E<strong>co</strong>nomic Development/Planning 30,490 25,231 23,091 1,032 10,426 19,241 (8,816) -45.82% 23,091 Town Planning/Building enforcement 38,276 52,506 49,119 2,331 21,186 40,931 (19,745) -48.24% 49,119 Licensing & Regulation – – – – – – – Road transport 565,959 185,093 301,605 22,259 189,316 251,327 (62,012) -24.67% 301,605 Roads 564,323 183,673 300,253 22,194 188,325 250,201 (61,876) -24.73% 300,253 Public Buses – – – – – – – Parking Garages 1,636 1,420 1,352 66 991 1,127 (136) -12.06% 1,352 Vehicle Licensing and Testing – – – – – – – Other – – – – – – – Environmental protection 17,812 16,234 15,852 1,120 11,718 13,210 (1,491) -11.29% 15,852 Pollution Control – – – – – – – Biodiversity & Landscape – – – – – – – Other 17,812 16,234 15,852 1,120 11,718 13,210 (1,491) -11.29% 15,852 Trading services 1,814,889 2,398,893 2,777,546 165,777 1,726,247 2,314,529 (588,283) -25.42% 2,777,546 Electricity 1,158,684 1,656,949 1,931,669 95,979 1,081,721 1,609,659 (527,938) -32.80% 1,931,669 Electricity Distribution 1,158,684 1,649,546 1,924,266 95,483 1,072,324 1,603,491 (531,167) -33.13% 1,924,266 Electricity Generation 0 7,403 7,403 496 9,398 6,169 3,229 52.34% 7,403 Water 412,423 518,065 585,214 49,617 451,867 487,659 (35,791) -7.34% 585,214 Water Distribution 412,423 518,065 585,214 49,617 451,867 487,659 (35,791) -7.34% 585,214 Water Storage – – – – – Waste water management 130,995 116,246 150,403 11,178 114,200 125,331 (11,131) -8.88% 150,403 Sewerage 130,995 116,246 150,403 11,178 114,200 125,331 (11,131) -8.88% 150,403 Storm Water Management – – – – – Public Toilets – – – – – Waste management 112,787 107,633 110,261 9,002 78,458 91,880 (13,422) -14.61% 110,261 Solid Waste 112,787 107,633 110,261 9,002 78,458 91,880 (13,422) -14.61% 110,261 Other 14,890 14,206 17,556 1,179 12,178 14,629 (2,451) -16.76% 17,556 Air Transport 184 345 344 1 81 286 (206) -71.89% 344 Abattoirs – – – – – – – Tourism 4,706 – – – – – – – Forestry – – – – – – – Markets 10,000 13,861 17,212 1,177 12,097 14,343 (2,246) -15.66% 17,212 Total Expenditure - Standard 3,821,255 4,176,315 4,780,621 275,507 2,855,292 3,983,691 (1,128,399) -28.33% 4,780,621 Surplus/ (Deficit) for the year 350,924 712,001 775,405 (8,426) 865,156 646,145 219,011 33.90% 775,405 20
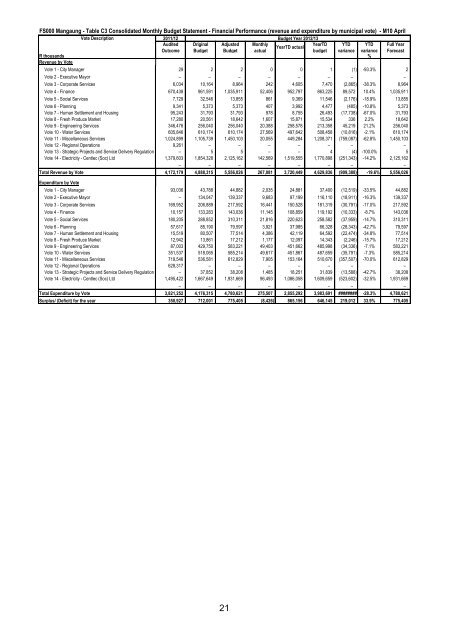
FS000 <strong>Mangaung</strong> - Table C3 Consolidated Monthly Budget Statement - Financial Performance (revenue and expenditure by municipal vote) - M10 April Vote Description 2011/12 Budget Year 2012/13 Audited Original Adjusted Monthly YearTD YTD YTD Full Year YearTD actual Out<strong>co</strong>me Budget Budget actual budget variance variance Forecast R thousands % Revenue by Vote Vote 1 - City Manager 29 2 2 0 0 1 (1) -93.3% 2 Vote 2 - Executive Mayor – – – – – – – – Vote 3 - Corporate Services 6,034 10,164 8,964 242 4,605 7,470 (2,865) -38.3% 8,964 Vote 4 - Finance 670,438 961,591 1,035,911 52,406 952,797 863,225 89,572 10.4% 1,035,911 Vote 5 - Social Services 7,729 32,546 13,855 861 9,369 11,546 (2,176) -18.9% 13,855 Vote 6 - Planning 9,341 5,373 5,373 407 3,992 4,477 (485) -10.8% 5,373 Vote 7 - Human Settlement and Housing 95,243 31,793 31,793 978 8,755 26,493 (17,738) -67.0% 31,793 Vote 8 - Fresh Produce Market 17,280 20,561 18,642 1,607 15,871 15,534 336 2.2% 18,642 Vote 9 - Engineering Services 346,476 256,040 256,040 20,388 258,578 213,358 45,219 21.2% 256,040 Vote 10 - Water Services 605,846 610,174 610,174 27,569 497,642 508,458 (10,816) -2.1% 610,174 Vote 11 - Miscellaneous Services 1,024,899 1,105,739 1,450,103 20,055 449,284 1,208,371 (759,087) -62.8% 1,450,103 Vote 12 - Regional Operations 9,261 – – – – – – – Vote 13 - Strategic Projects and Service Delivery Regulation – 5 5 – – 4 (4) -100.0% 5 Vote 14 - Electricity - Centlec (Soc) Ltd 1,379,603 1,854,328 2,125,162 142,569 1,519,555 1,770,898 (251,343) -14.2% 2,125,162 – – – – – – – – Total Revenue by Vote 4,172,179 4,888,315 5,556,026 267,081 3,720,449 4,629,836 (909,388) -19.6% 5,556,026 Expenditure by Vote Vote 1 - City Manager 93,036 43,788 44,882 2,035 24,881 37,400 (12,519) -33.5% 44,882 Vote 2 - Executive Mayor – 134,047 139,337 9,683 97,199 116,110 (18,911) -16.3% 139,337 Vote 3 - Corporate Services 169,952 206,889 217,592 16,441 150,528 181,319 (30,791) -17.0% 217,592 Vote 4 - Finance 10,157 133,283 143,036 11,145 108,859 119,192 (10,333) -8.7% 143,036 Vote 5 - Social Services 180,205 288,852 310,311 21,816 220,623 258,582 (37,959) -14.7% 310,311 Vote 6 - Planning 57,617 85,190 79,597 3,921 37,985 66,328 (28,343) -42.7% 79,597 Vote 7 - Human Settlement and Housing 15,519 80,507 77,514 4,386 42,119 64,592 (22,474) -34.8% 77,514 Vote 8 - Fresh Produce Market 12,942 13,861 17,212 1,177 12,097 14,343 (2,246) -15.7% 17,212 Vote 9 - Engineering Services 87,003 429,750 583,221 49,403 451,662 485,998 (34,336) -7.1% 583,221 Vote 10 - Water Services 351,537 518,065 585,214 49,617 451,867 487,659 (35,791) -7.3% 585,214 Vote 11 - Miscellaneous Services 719,546 536,581 612,829 7,905 153,164 510,670 (357,507) -70.0% 612,829 Vote 12 - Regional Operations 628,317 – – – – – – – Vote 13 - Strategic Projects and Service Delivery Regulation – 37,852 38,208 1,485 18,251 31,839 (13,588) -42.7% 38,208 Vote 14 - Electricity - Centlec (Soc) Ltd 1,495,422 1,667,649 1,931,669 96,493 1,086,058 1,609,659 (523,602) -32.5% 1,931,669 – – – – – – – – Total Expenditure by Vote 3,821,252 4,176,315 4,780,621 275,507 2,855,292 3,983,691 ######## -28.3% 4,780,621 Surplus/ (Deficit) for the year 350,927 712,001 775,405 (8,426) 865,156 646,145 219,012 33.9% 775,405 21